How to Actually Read Your AI Agent's Langfuse Dashboard
How to Actually Read Your AI Agent’s Langfuse Dashboard: A Hands-On Guide for LLM Developers
You built four different agent architectures, ran a benchmark, and got scores of 100%, 96.7%, 96.7%, and 40%. Now what? You know “who’s better” but not “why.” This guide teaches you how to use Langfuse to open the black box.
Table of Contents
- Who This Guide Is For
- My Experiment Setup
- Stop 1: The Tracing Page
- Stop 2: Inside a Trace
- Stop 3: Inside the LLM Call
- Real-World Debug: A ReAct FAIL Case
- Stop 4: Comparing Four Agents
- Stop 5: Scores and Sessions Pages
- Advanced: Process-Level Scoring Beyond Pass/Fail
- Exporting Data for Further Analysis
- Self-Assessment: Do You Actually Know This?
- Appendix: Quick Troubleshooting Reference
- Appendix: Langfuse Page Navigation
Who This Guide Is For
You already know how to build agents with LangGraph (or any LLM framework) and you’ve run some evaluations. But you’ve realized that pass rates alone aren’t enough — you want to know what happened inside the agent at every step, where the money went, and which step went wrong.
If you haven’t set up a Langfuse account or sent any traces yet, this is not a setup tutorial. This guide starts where setup ends: your traces are in, the dashboard is open, now what?
My Experiment Setup
To give this walkthrough a concrete subject, I used a small math evaluation project:
- 4 LangGraph Agents: CoT (Chain of Thought), ReAct, Constrained ReAct, Multi-Agent
- 30 math word problems, each with a ground truth answer
- Model: GPT-4o (temperature: 0)
- Langfuse Cloud (Hobby plan) as the observability backend
- Source code: github.com/johnson00111/math-agent-eval — clone it and follow along
Each agent runs all 30 problems = 120 traces sent automatically to Langfuse. Below is what I saw when I opened the dashboard, how I read it, and every mistake I made along the way.
Stop 1: The Tracing Page — Your Trace List
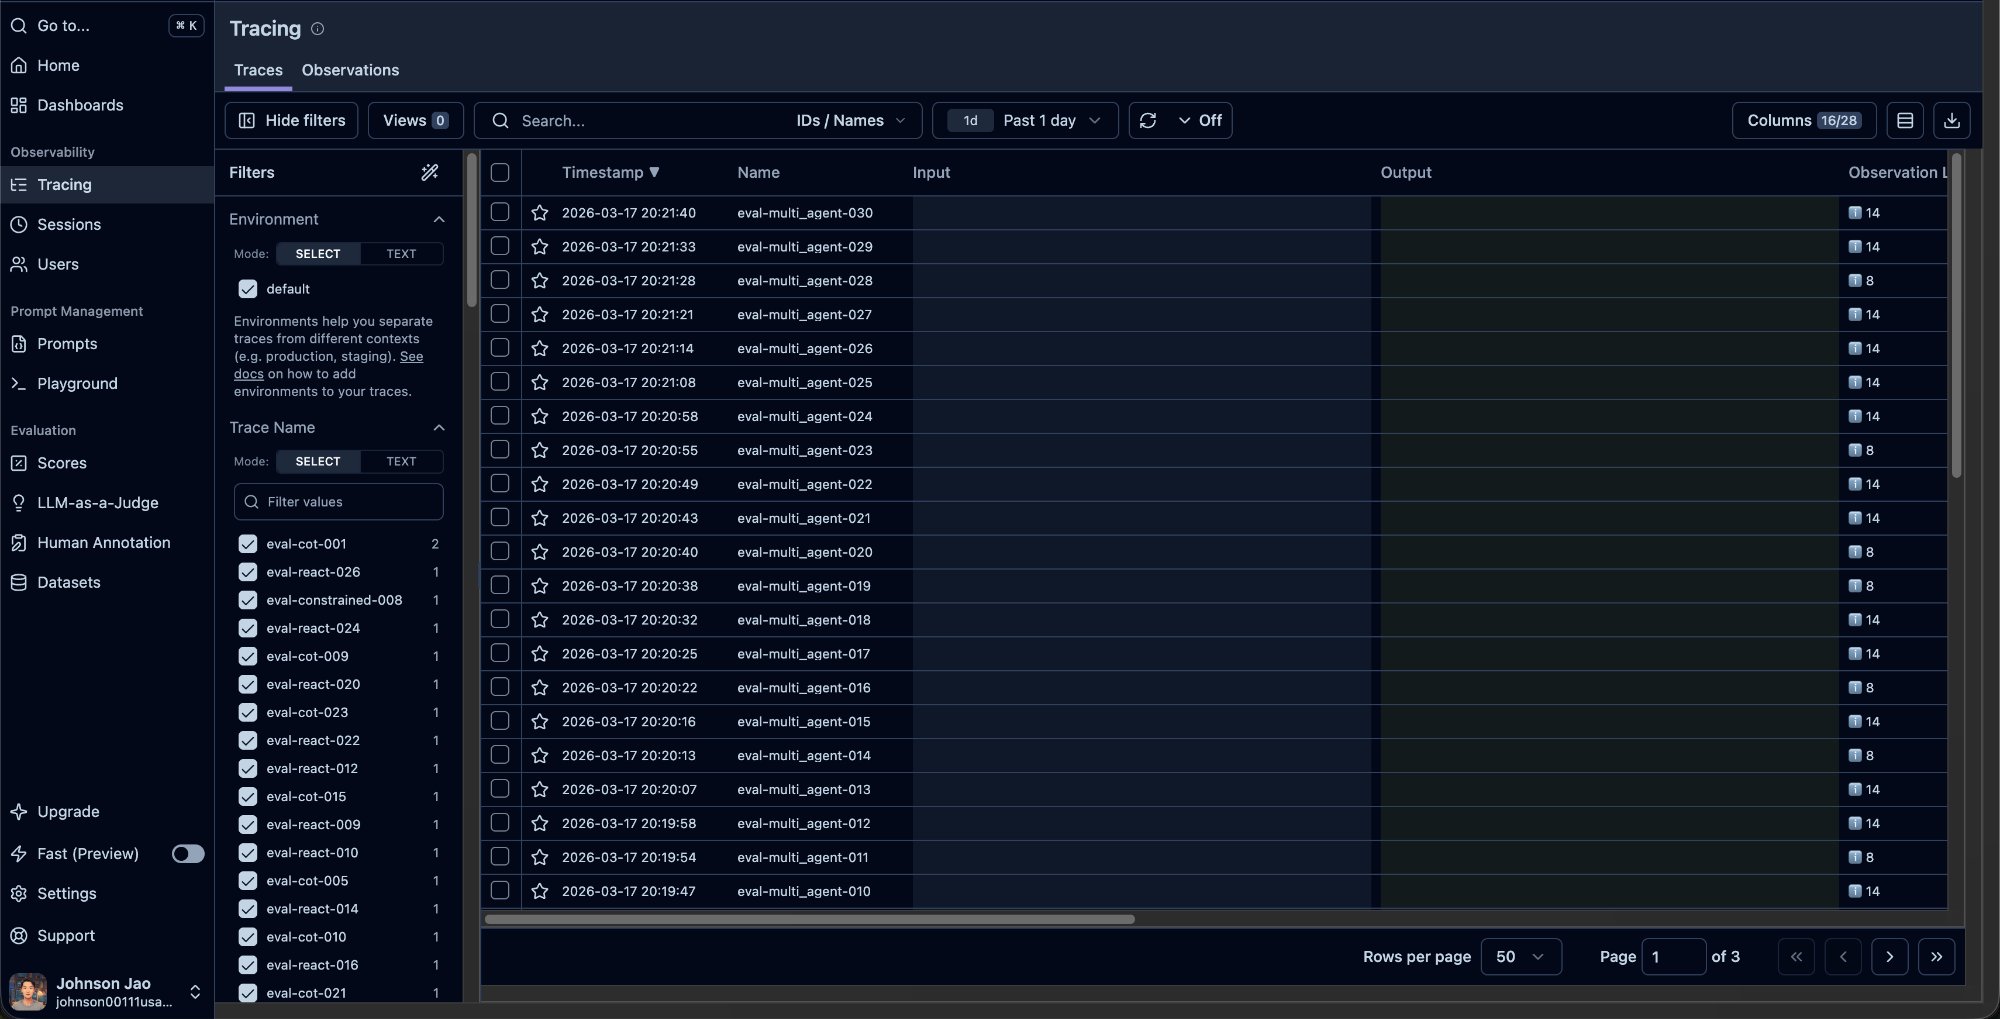
Open Langfuse, click “Tracing” in the left sidebar. This is the page you’ll spend the most time on.
Page Layout
The page has three zones:
Left filter panel: This is your key tool for comparing agents. Under Trace Name, you’ll see all distinct trace names with their counts. You can also filter by Session ID, User ID, Metadata, Score, and more.
Center trace list: Each row is one agent answering one question. Columns include Timestamp, Name, Input/Output, and usually Score and Observation count on the right edge.
What to look for: Scan the Score column first. 1.0 means PASS, 0.0 means FAIL. The FAIL rows are the ones worth clicking into.
Gotcha: Make Sure You’re Looking at Your Own Project
The first time I opened Langfuse, I spent several minutes staring at traces before realizing I was looking at the Demo Project, not my own.
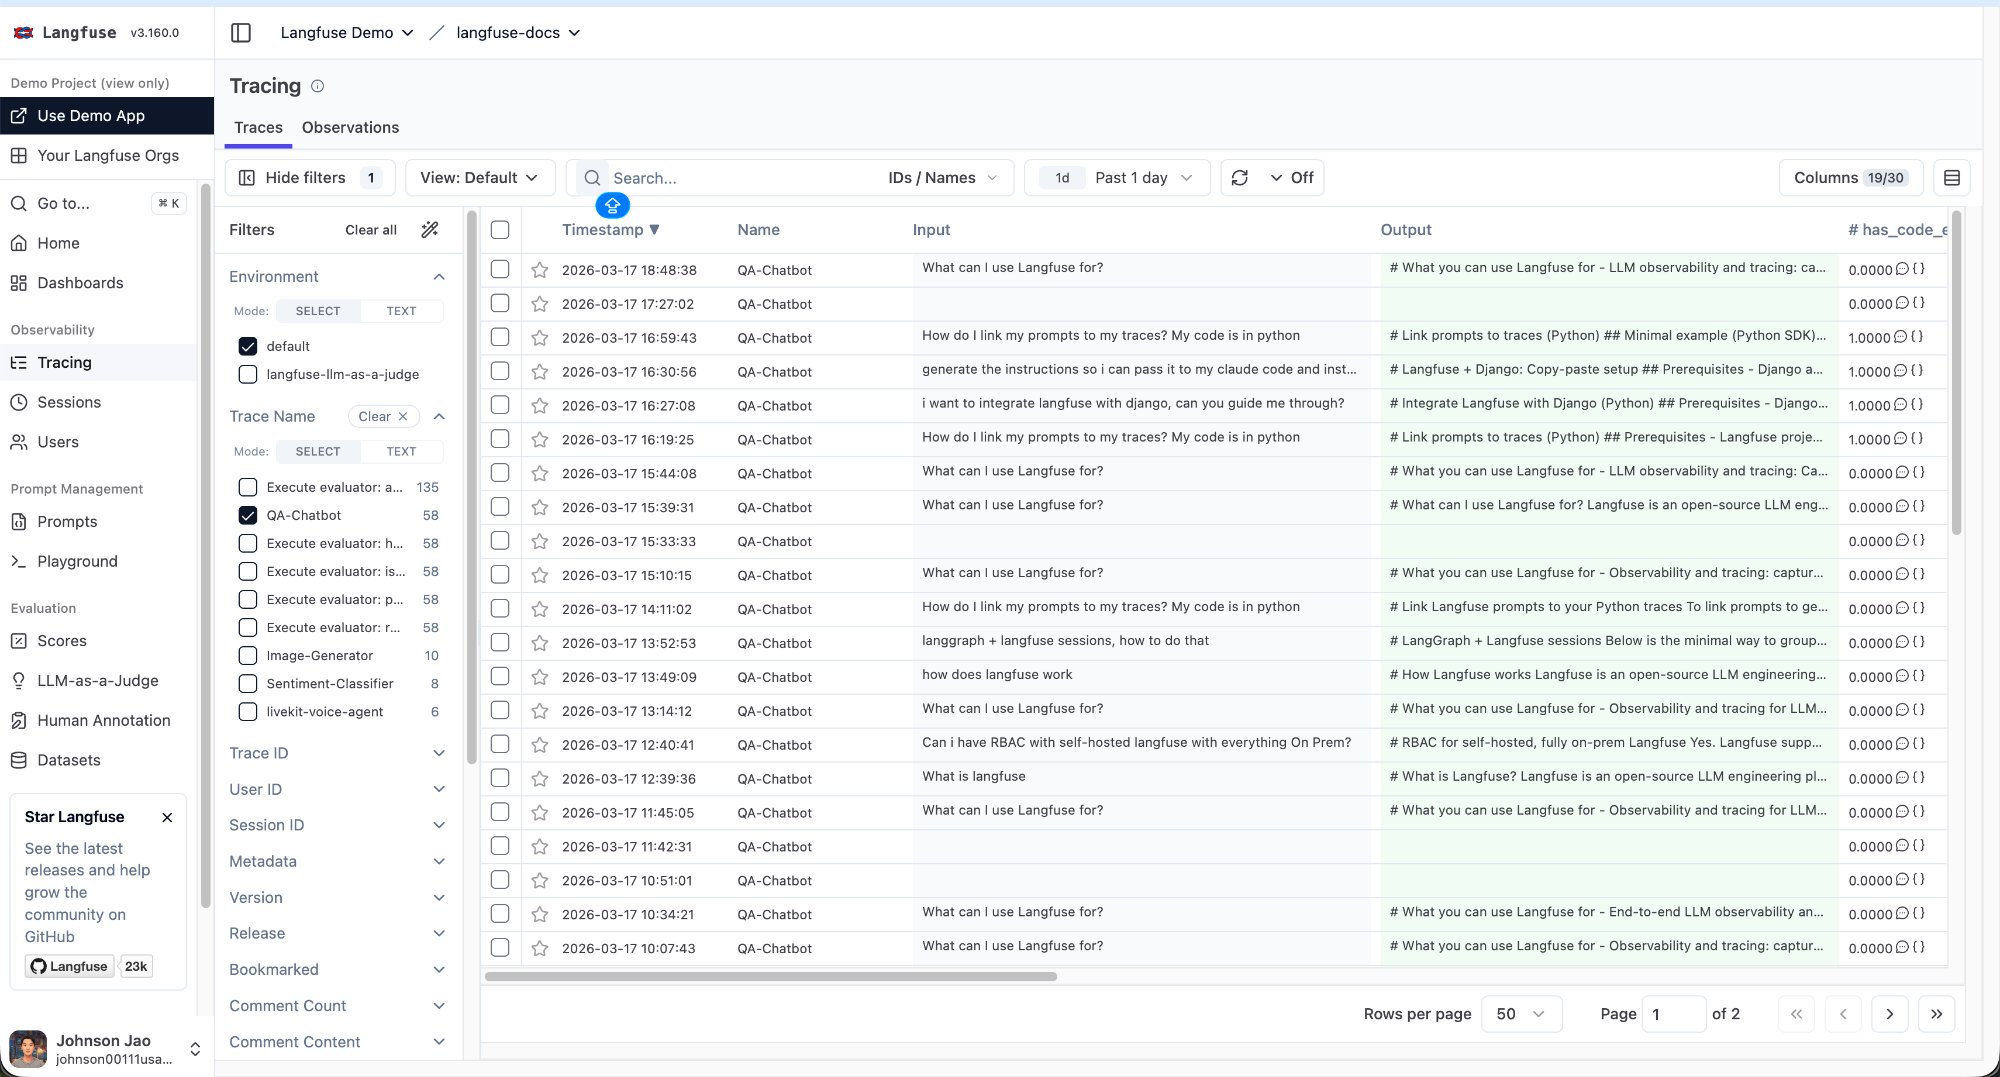
The clue is in the top-left corner — if it says “Langfuse Demo > langfuse-docs” instead of your org name, you’re in the demo. Click the dropdown to switch to your own project.
Gotcha: Input/Output Columns Are Empty
After switching to my own project, I noticed the Input and Output columns in the trace list were completely blank.
Why: LangGraph’s CallbackHandler automatically records prompts and responses inside the inner ChatOpenAI observation, but it does not write them to the outermost trace level. If you don’t explicitly pass input and output parameters when creating the trace, the list page shows nothing.
Fix: Add an input parameter to start_as_current_observation(), and call span.update(output=...) after the agent finishes. Important: span.update() must be called inside the with span: block — I initially placed it outside, and because the span had already closed, the output never got written.
How to Filter for Agent Comparison
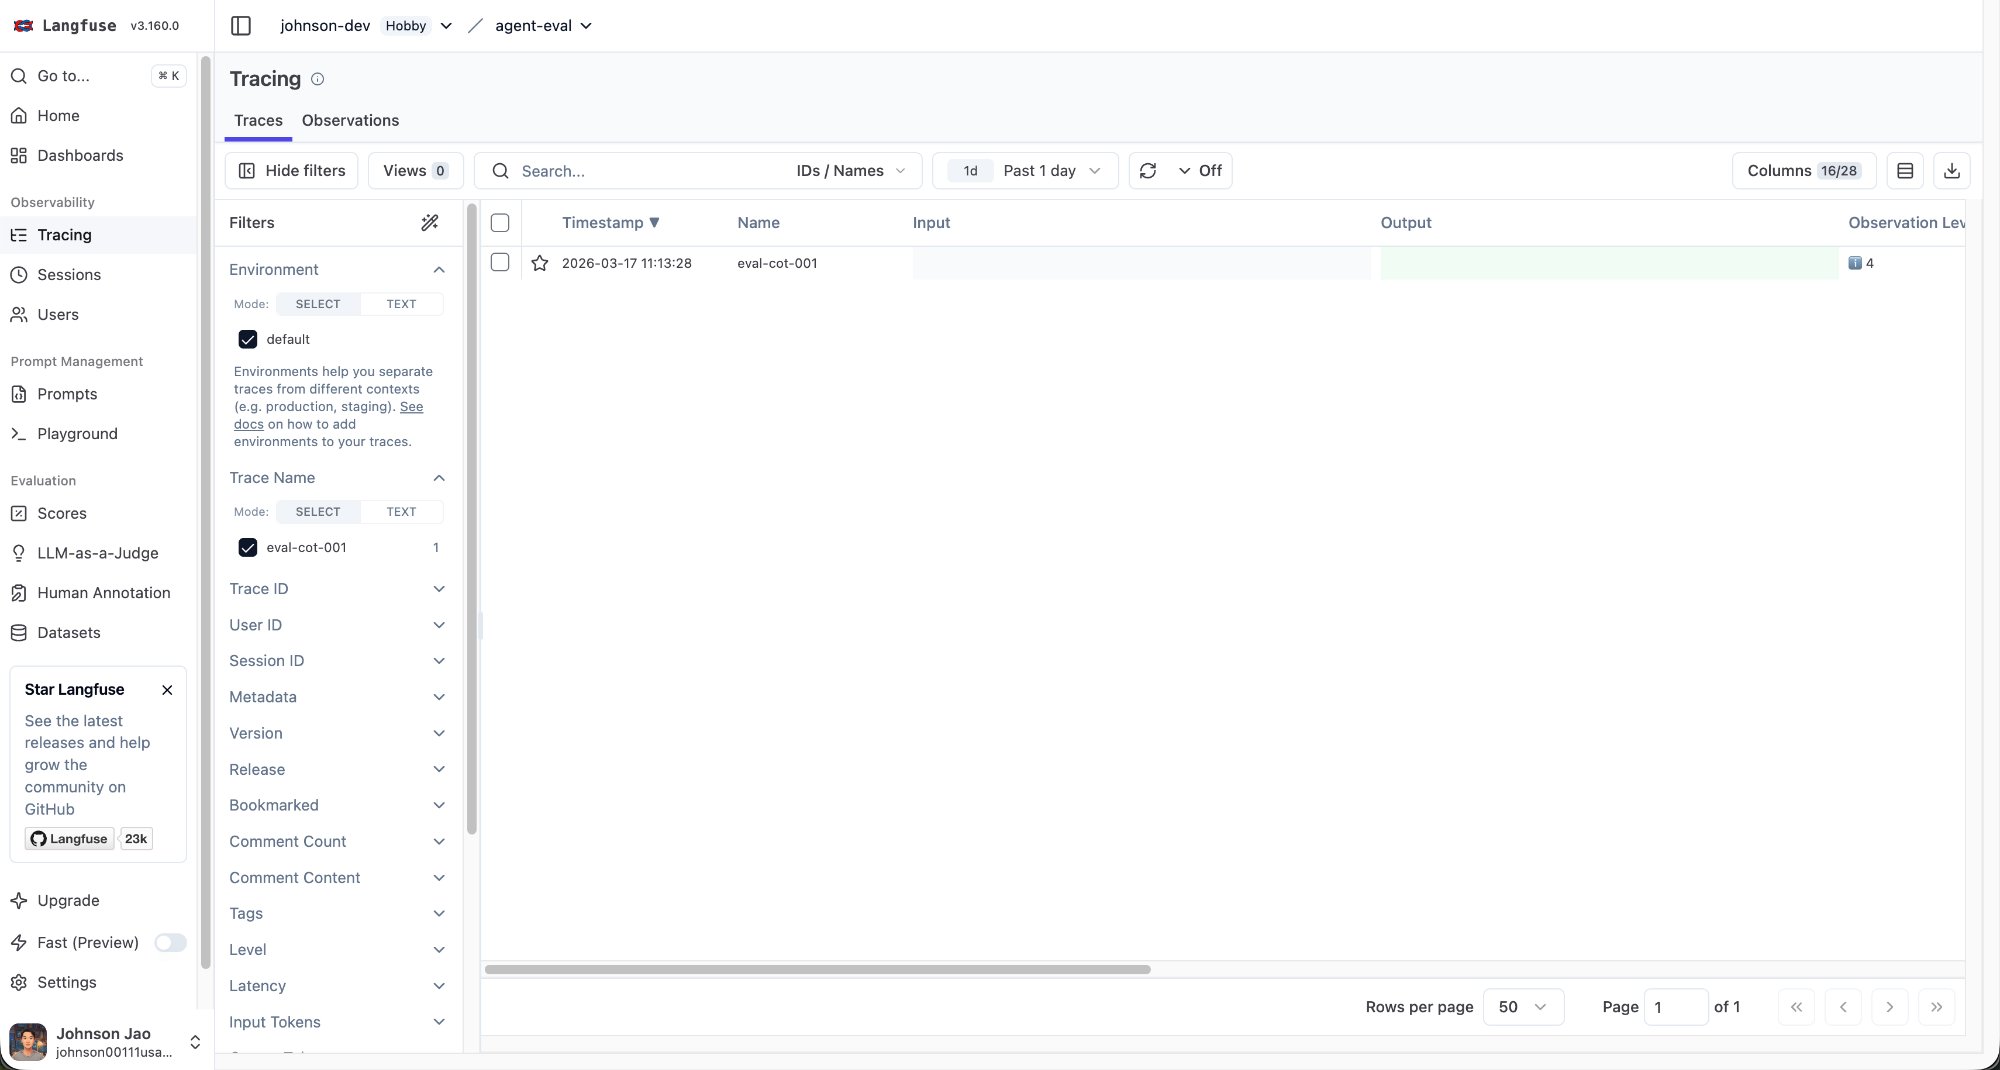
With 120 traces in the list, you need to filter by agent type. If your trace names follow a pattern like eval-cot-001, eval-react-018, each name is unique and the filter panel lists 120 entries with count 1 each — you can’t select “all CoT” in one click.
Fix: Use TEXT mode for fuzzy search. The Trace Name filter has SELECT and TEXT buttons. Switch to TEXT mode and type cot to filter all traces whose names contain “cot”. Type react for all ReAct traces.
An even better approach is to use tags in your code (e.g., tags=["cot"]), so you can filter directly in the Tags section of the filter panel.
Stop 2: Inside a Trace — The Waterfall View
This is the most valuable screen in Langfuse. Click any row in the trace list to open its detail page.
Page Layout
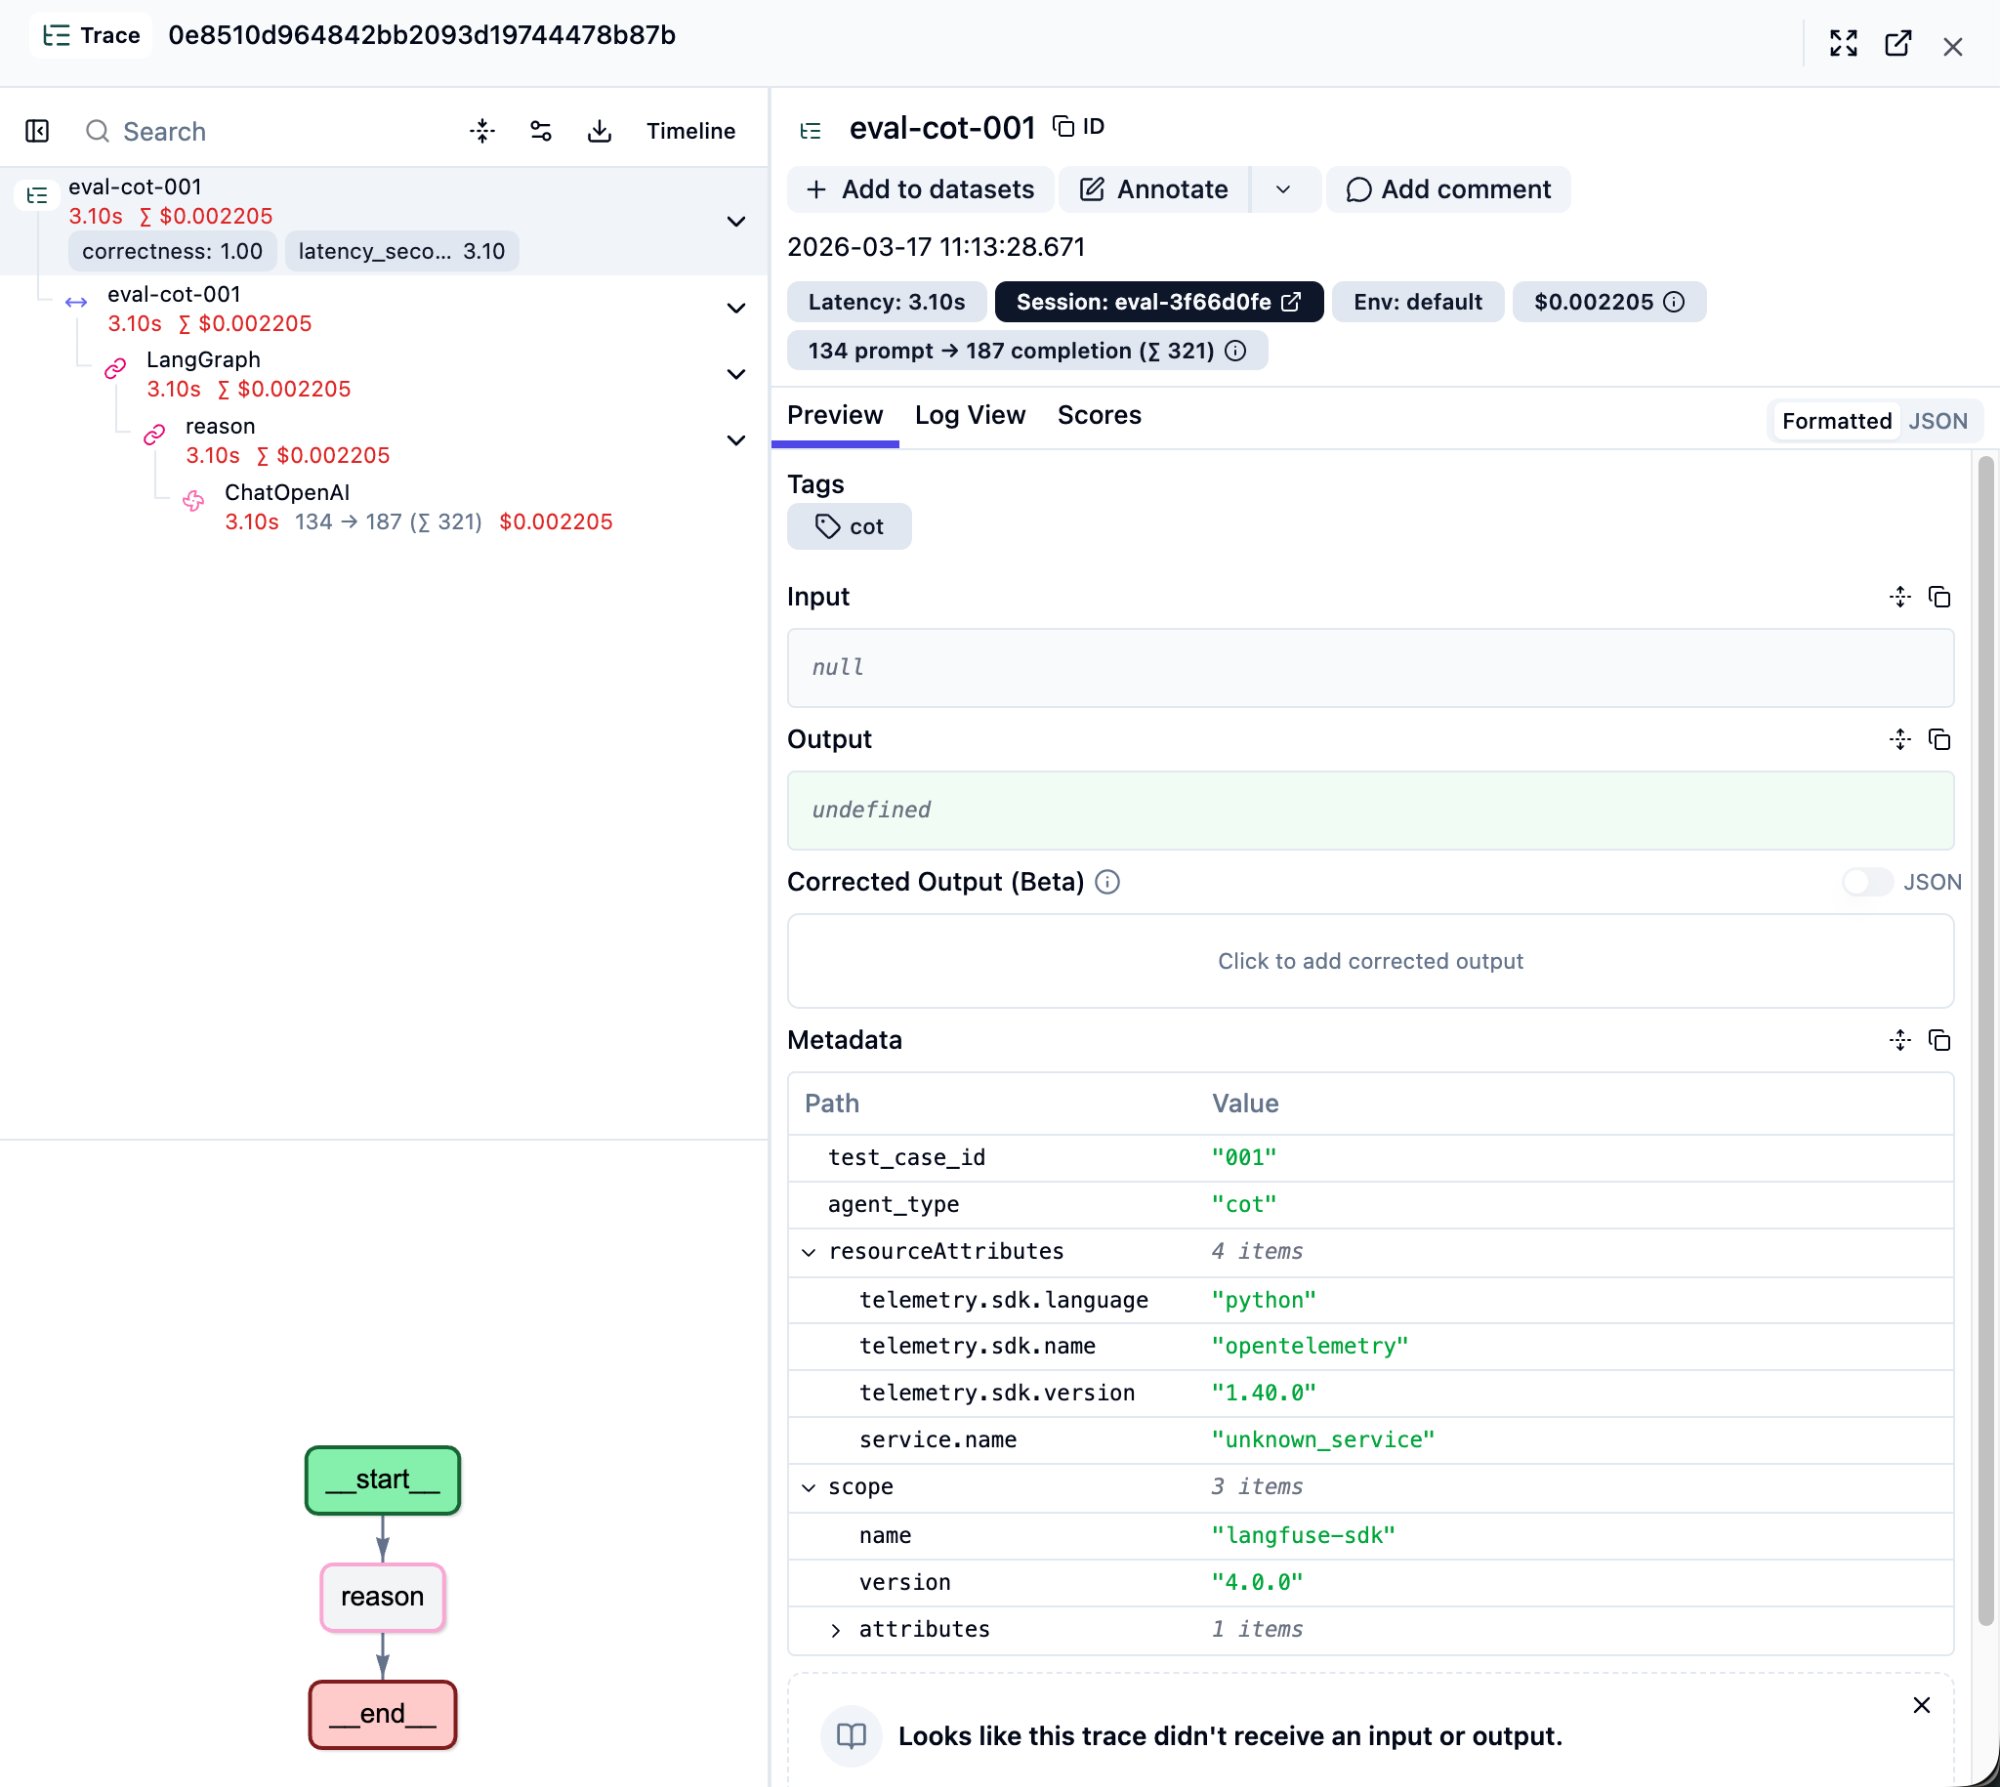
Left side: Step tree
This is the full execution tree of the agent’s internals. The top level is the trace itself, with nested spans and generations below it. Each node shows:
- Execution time (e.g., 3.10s)
- Cumulative cost (e.g., $0.002)
- Token breakdown for LLM calls (e.g., 134 -> 187)
- Score badges (e.g.,
correctness: 1.00)
Right side: Detail panel
Click any node on the left, and the right panel shows that step’s complete information: raw Input/Output content, Metadata, Scores.
Bottom-left: LangGraph flow diagram
Your graph structure is visualized here. A CoT agent shows __start__ -> reason -> __end__ as a straight line. A ReAct agent shows agent <-> tools loops with iteration counts (e.g., agent (2/2), tools (2/2)).
Key Concept: Trace Level vs. Observation Level
This was the concept that took me the longest to understand. A single trace contains multiple nested observations:
eval-cot-001          <- Trace level (outermost): what the Tracing list shows
 |-- eval-cot-001     <- Span: LangGraph wrapper
     |-- LangGraph    <- Span: graph execution
         |-- reason   <- Span: graph node
             |-- ChatOpenAI  <- Observation level (innermost): LLM call details live here
The Tracing list page reads from the outermost trace’s Input/Output. Clicking ChatOpenAI in the waterfall reads from the innermost observation’s Input/Output. They are different.
This distinction becomes critical when setting up LLM-as-a-Judge later — choosing “Run on Traces” vs. “Run on Observations” gives the evaluator completely different data.
Different Agents Have Different Trees
CoT agent trees are shallow: One reason node with a single ChatOpenAI call inside. Simple and direct.
ReAct agent trees have loops:
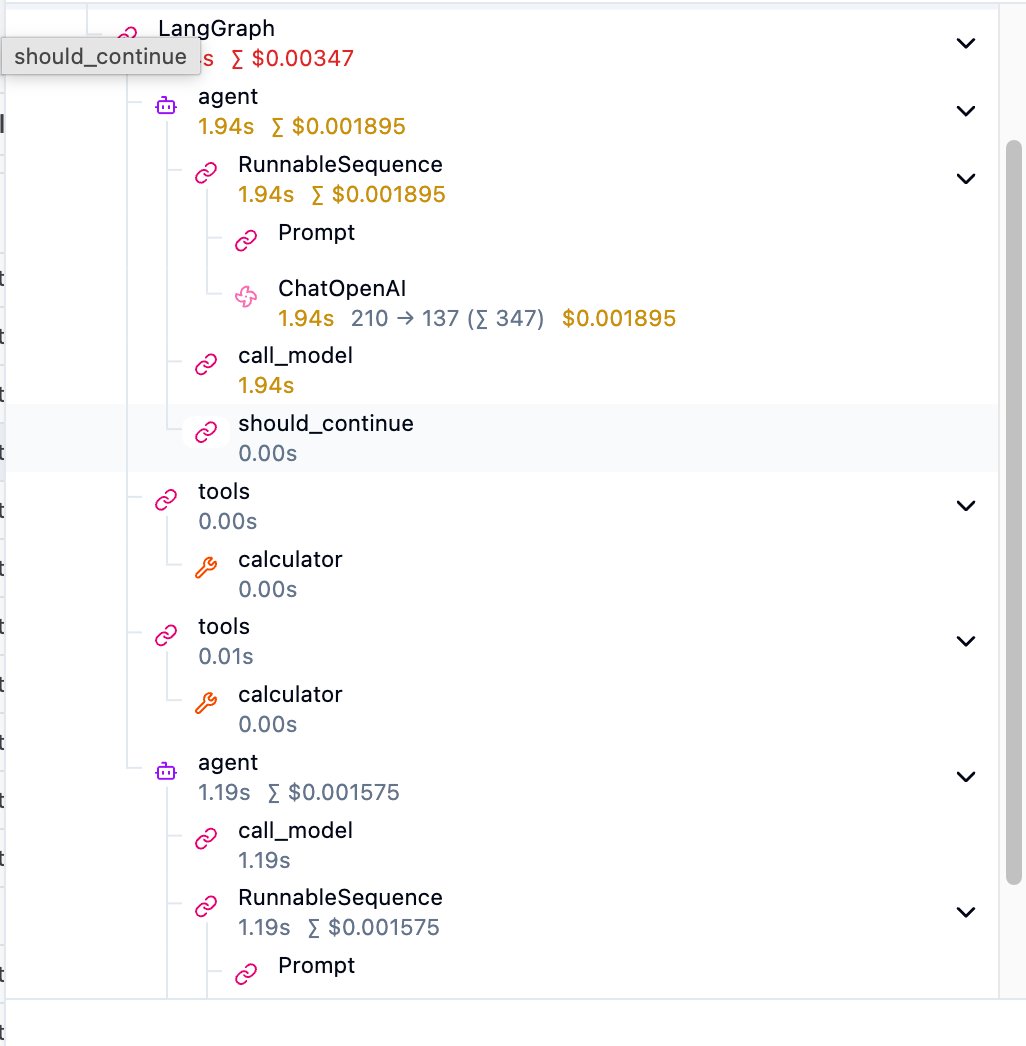
The structure is agent -> RunnableSequence -> ChatOpenAI (first LLM call), then tools -> calculator (tool execution), then another agent (second LLM call). should_continue is LangGraph’s routing decision — “Did the LLM request a tool call? If yes, continue the loop; if no, end.”
Multi-Agent trees are the deepest: Each sub-agent (planner, calculator, verifier) is its own subtree nested inside the main graph.
Stop 3: Inside the LLM Call — Seeing the Prompt and Response
In the step tree, find the ChatOpenAI node (or whatever LLM provider you use) and click it. This is the single most important layer for debugging.
Top Metric Bar
A row of badges shows everything about this LLM call:
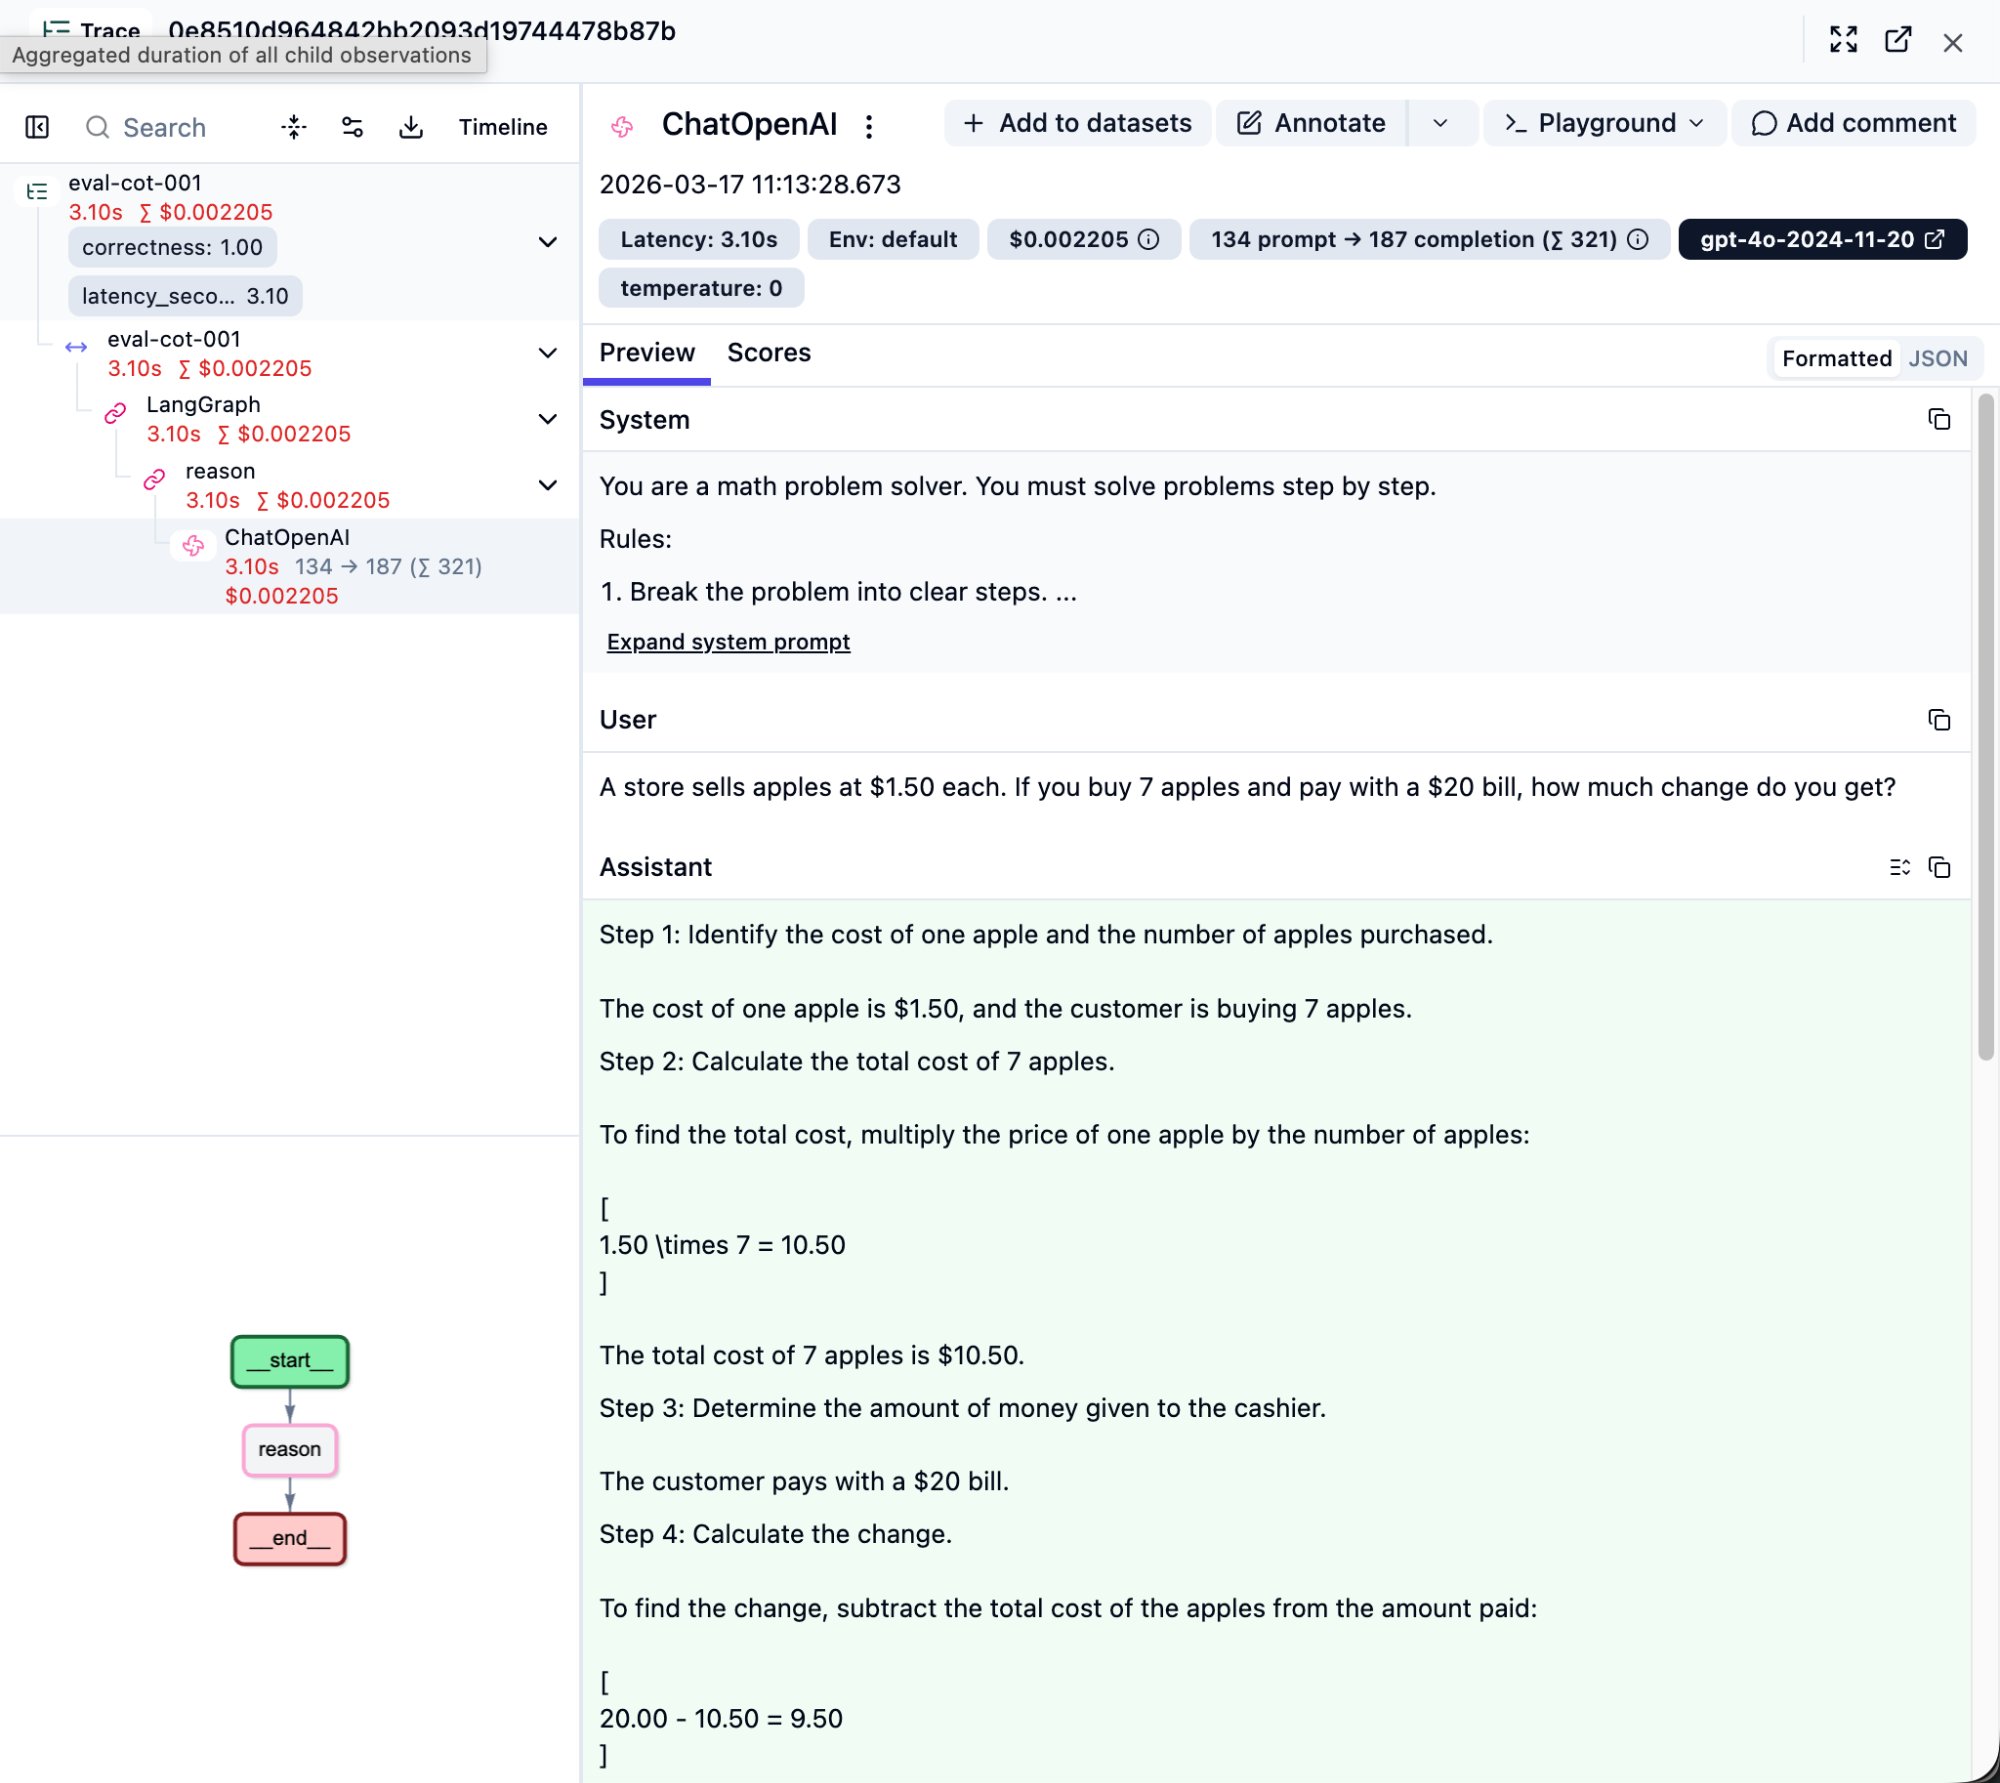
- Latency: 3.10s — API round-trip time
- 134 prompt -> 187 completion (sum 321) — prompt tokens, completion tokens, total
- $0.002205 — cost of this single call
- gpt-4o-2024-11-20 — the exact model snapshot used
- temperature: 0 — confirms deterministic output
System / User / Assistant
The right panel expands the full LLM conversation into three sections:
System: Your prompt template. Verify it matches what you intended — sometimes prompts don’t get injected correctly, and this is where you’ll catch it. Click “Expand system prompt” for the full text.
User: The actual input question.
Assistant: The LLM’s complete response. For a CoT agent, you’ll see the step-by-step reasoning (Step 1, Step 2…). This is the core value of CoT — the reasoning process is made visible. If the answer is wrong, you can pinpoint exactly which step went off track.
Metadata Section
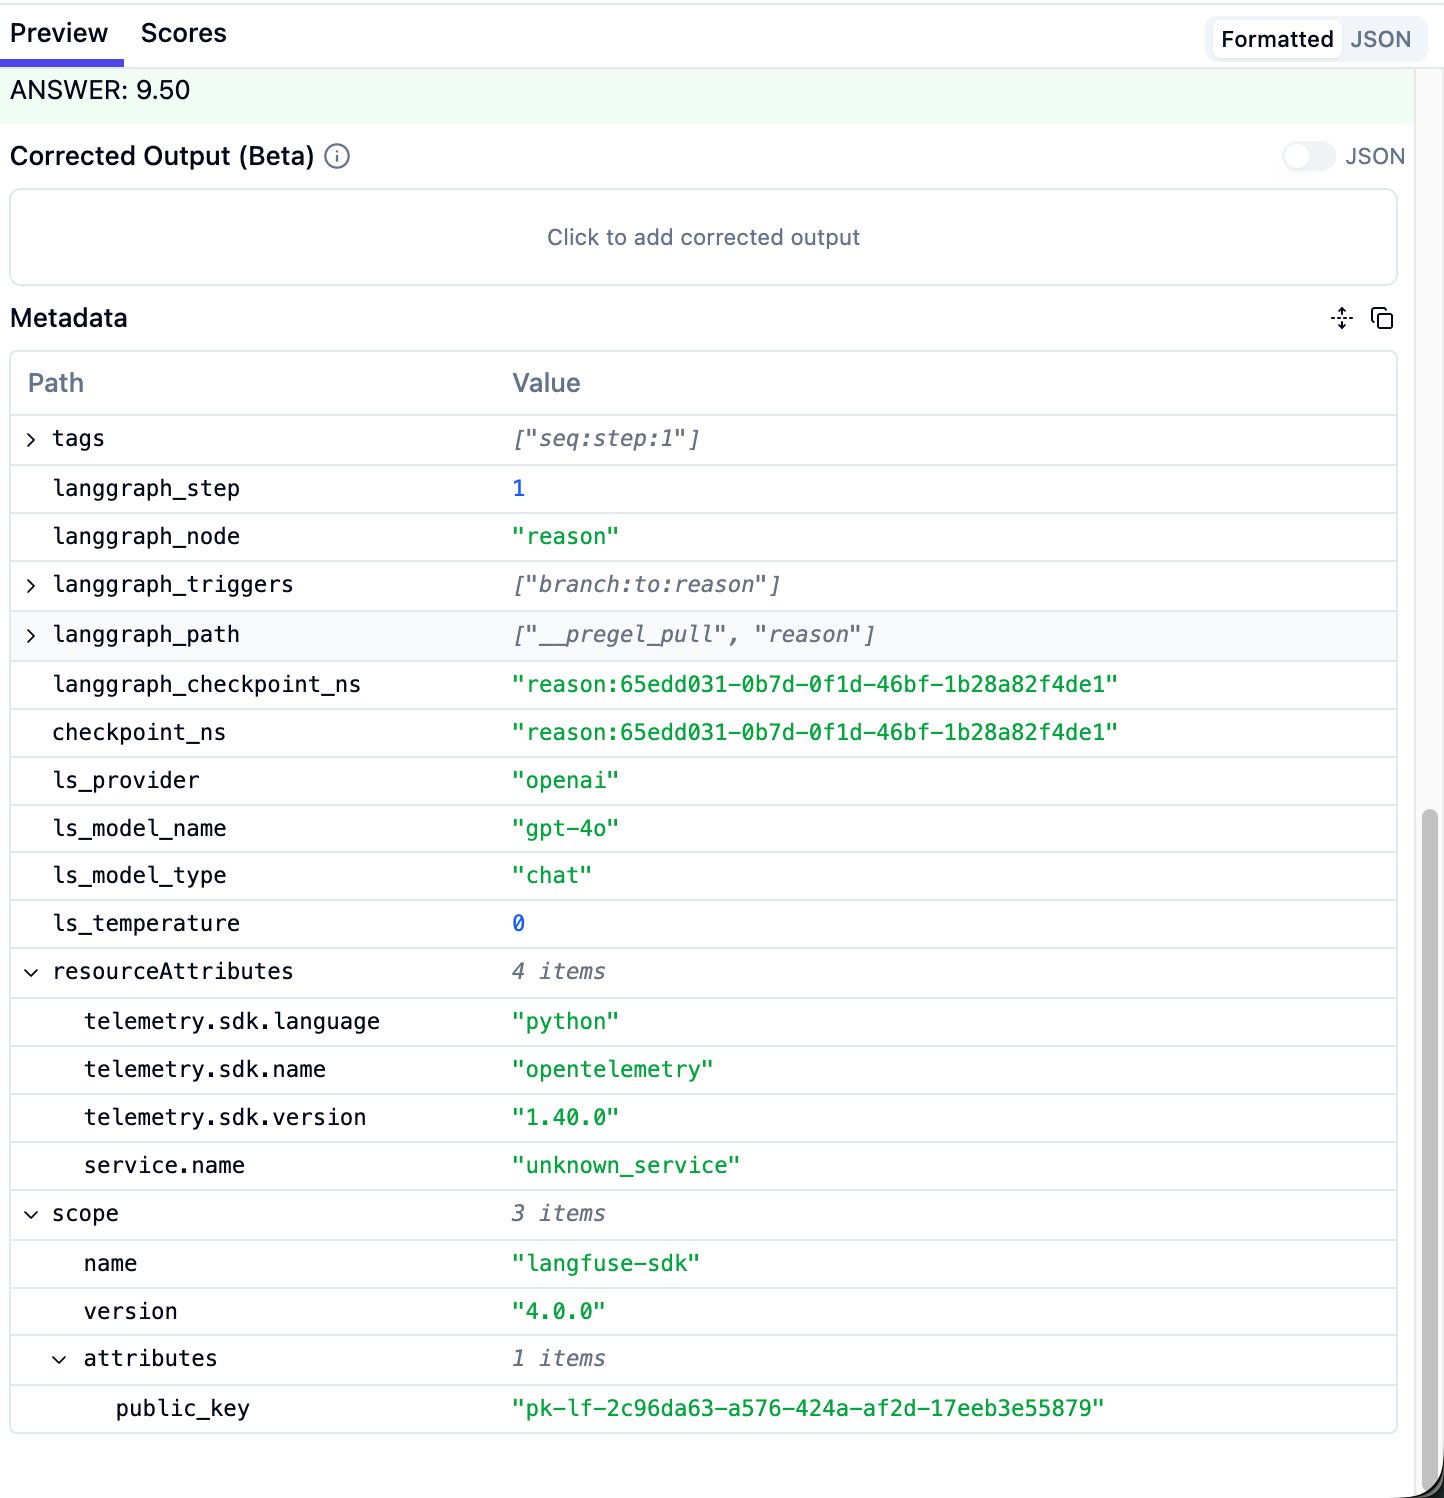
Scroll down to find metadata. Important fields include: langgraph_node (which graph node this is), ls_provider (LLM provider), ls_model_name (model), ls_temperature. These can be used for filtering and grouping later.
ReAct-Specific: Tool Call Arguments
In a ReAct agent’s first-round ChatOpenAI response, you’ll see the tool call function names and arguments. For example:
1. calculator
   Arguments: 0.65 * 40

2. calculator
   Arguments: 0.75 * (0.65 * 40)
This tells you what calculation the LLM “wanted to perform.” If the expression is wrong, the bug is here. If the expression is correct but the final answer is wrong, the problem is in the next LLM call (interpreting the tool result).
Real-World Debug: A ReAct FAIL Case
Let me walk through a real debugging case. This is the actual path I followed to locate a root cause in Langfuse.
Spotting the Problem
In the Tracing page, I saw eval-react-018 with a score of correctness: 0.00.
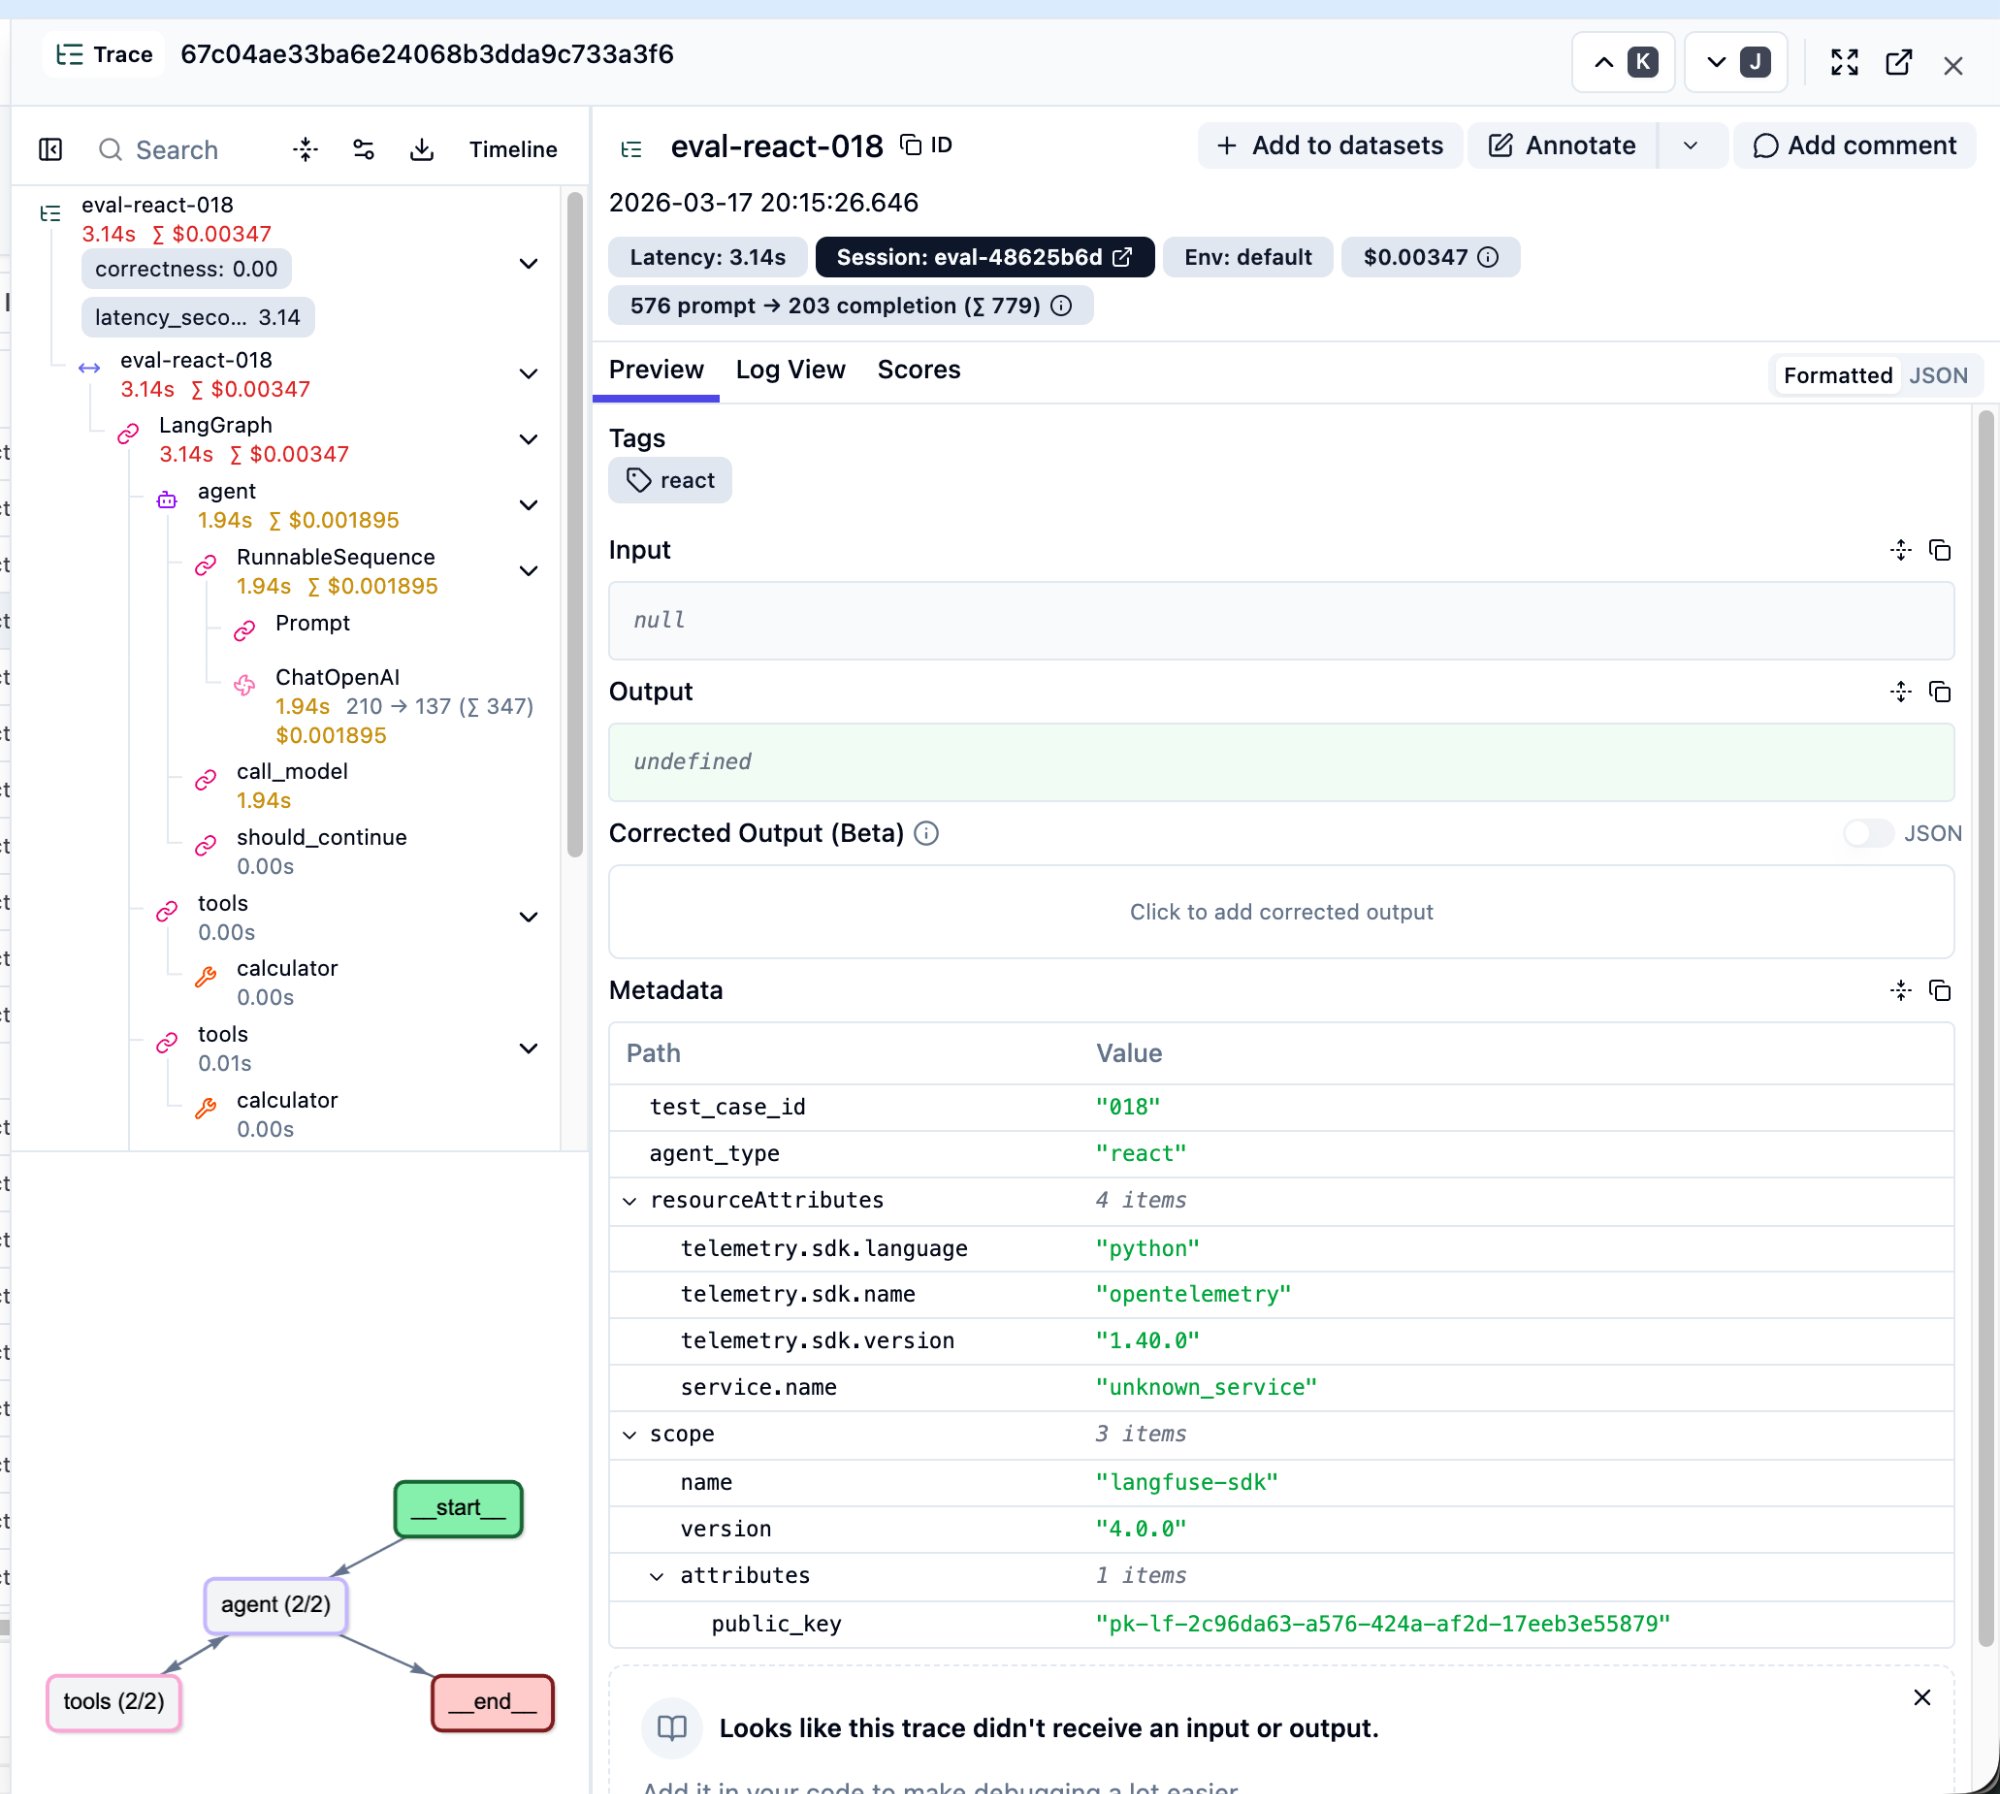
Several things stand out: correctness: 0.00 in the top-left confirms a wrong answer. The step tree is much deeper than CoT — two rounds of agent + tools loops. Token usage is 779 (2.4x CoT’s 321). Cost is $0.0035. The bottom-left graph shows agent (2/2) and tools (2/2).
First LLM Call: Reasoning Was Correct
The problem: “In a class of 40 students, 65% passed the exam. Of those who passed, 75% scored above 80. How many students scored above 80?”
Clicking the first ChatOpenAI node, the LLM’s reasoning and tool call arguments were both correct: 0.65 * 40 -> calculator returned 26, 0.75 * (0.65 * 40) -> calculator returned 19.5.
Second LLM Call: Here’s Where It Went Wrong
The LLM received 19.5 from the calculator and responded:
Since the number of students must be a whole number, we interpret this as approximately 20 students scoring above 80. ANSWER: 20
The LLM decided on its own that “student count can’t be a decimal” and rounded 19.5 up to 20. But the ground truth was 19.5.
Conclusion
This isn’t a reasoning error or a tool call error. It’s a conflict between the agent’s “helpful” behavior and the evaluation standard. The ReAct agent made a reasonable real-world inference, but the eval expected the precise mathematical answer.
Without Langfuse: You only know “ReAct got question 18 wrong.”
With Langfuse: In under two minutes you can trace the path: trace list -> click the FAIL trace -> step tree -> first-round reasoning correct -> tool call arguments correct -> calculator returned 19.5 -> second-round LLM rounded up -> root cause identified.
Then you can decide: fix the agent’s prompt (tell it not to round), or fix the ground truth (accept 20 as correct).
Stop 4: Comparing Four Agents
Results after running all 120 questions:
| Metric | CoT | ReAct | Constrained | Multi-Agent |
|---|---|---|---|---|
| Accuracy | 96.7% | 96.7% | 100.0% | 40.0% |
| Avg Latency | 3.6s | 5.2s | 4.9s | 5.5s |
| Avg Tokens / Question | 465 | 1,468 | 1,756 | 1,394 |
| Avg Cost / Question | $0.004 | $0.006 | $0.006 | $0.006 |
| LLM Calls / Question | 1.1 | 2.9 | 3.5 | 3.1 |
| Reasoning Quality (LLM Judge) | 0.98 | 0.95 | 0.91 | 0.97 |
| Waterfall Depth | Shallow (1 LLM call) | Medium (multi-round loops) | Medium | Deep (nested sub-graphs) |
Several counterintuitive findings:
Constrained scored 100% accuracy but the lowest Reasoning Quality (0.91). It used the most tokens (1,756/question) and the most LLM calls (3.5/question) to achieve a perfect score. It works like a student who brute-forces every problem — the process isn’t elegant, but the answers are always right.
Multi-Agent scored only 40% accuracy but a high Reasoning Quality of 0.97. This is the most counterintuitive result — each sub-agent’s individual reasoning quality is high, but the combined result is terrible. The problem lies in inter-agent communication, not in any single agent’s reasoning ability. This is exactly the value of process-level scoring: if you only look at accuracy, you’d think Multi-Agent is “the dumbest”; but Reasoning Quality tells you it “thinks well but collaborates poorly.”
CoT is the overall winner. Fastest (3.6s), fewest tokens (465), cheapest ($0.004), highest Reasoning Quality (0.98), and 96.7% accuracy. The only question it got wrong was due to a rounding edge case. On this benchmark, the simplest architecture was the best.
ReAct used 3x the tokens but matched CoT’s accuracy exactly. ReAct averaged 2.9 LLM calls per question (CoT needed only 1.1), consuming 3x the tokens, yet achieved the same 96.7%. The extra tool calls provided no accuracy advantage on simple math problems — though they might make all the difference on tasks requiring external data retrieval.
Stop 5: Scores and Sessions Pages
Scores Page
Click “Scores” in the left sidebar. This aggregates all score data across your traces. The correctness, latency_seconds, and any process-level scores you sent via create_score() appear here. You can filter by trace name to see each agent’s pass rate.
Sessions Page
If your code sets a session_id (e.g., eval-3f66d0fe), all traces from the same eval run are grouped into one session. This makes it easy to compare “this run’s results vs. the last run after I changed the prompt.”
Dashboard Page
The Dashboard provides aggregate metrics: total traces, average latency, total cost, score trends. Use the time filter to lock onto your eval run’s time range.
Advanced: Process-Level Scoring Beyond Pass/Fail
After running 120 questions and reviewing the comparison table, you might ask: “Correctness only tells me right or wrong, but how do I know if the agent’s reasoning quality is good?”
That’s the right question. An agent might get the right answer with terrible reasoning (lucky guess), and another might get the wrong answer with nearly perfect reasoning (like the rounding issue in question 18). Pass rate alone can’t distinguish these two cases.
Two Independent Questions: “How to Compute” and “How to Deliver”
This is a core concept that took me a while to grasp.
“How to compute the score” has two approaches: Rule-based (deterministic metrics calculated with code) and LLM-as-a-Judge (another LLM reads the reasoning process and grades it).
“How to deliver the score to Langfuse” also has two approaches: Use Langfuse’s built-in evaluator UI, or call the create_score() API from your own code.
These two dimensions are independent. You can use Langfuse’s UI to run an LLM judge, or you can call Gemini from your own code and send the score back via create_score(). The result on the Scores page looks identical. Langfuse doesn’t care where the score came from — it just stores and displays.
Method 1: Rule-Based Scoring
I added four process-level metrics to run_eval.py, automatically computed after each question and sent back to Langfuse:
| Score Name | Meaning | How It’s Computed |
|---|---|---|
tool_call_count | How many tool calls the agent made | Count ToolMessage instances in messages |
reasoning_steps | How many reasoning steps were taken | Count “Step 1”, “Step 2” patterns |
answer_clarity | Whether the answer was cleanly formatted | Check if final_answer field contains ANSWER format |
efficiency | Overall efficiency (0-1) | Agent-type-specific formula penalizing excess tool calls or time |
These don’t require changing the agent code — the scoring logic runs in the eval runner after the agent finishes. The agent doesn’t need to know it’s being graded.
| Rule-Based | LLM-as-a-Judge | |
|---|---|---|
| What it can evaluate | Quantifiable metrics (counts, time, format) | Subjective quality (reasoning clarity, logical rigor) |
| Cost | Zero | Requires additional LLM tokens |
| Consistency | 100% deterministic | May vary slightly between runs |
| Requires re-running agents? | Yes | Not necessarily |
Method 2: LLM-as-a-Judge
Langfuse has a built-in LLM-as-a-Judge feature. Here’s the complete setup flow.
Step 1: Create an LLM Connection
On the LLM-as-a-Judge page in the left sidebar, first establish a connection to an LLM provider.
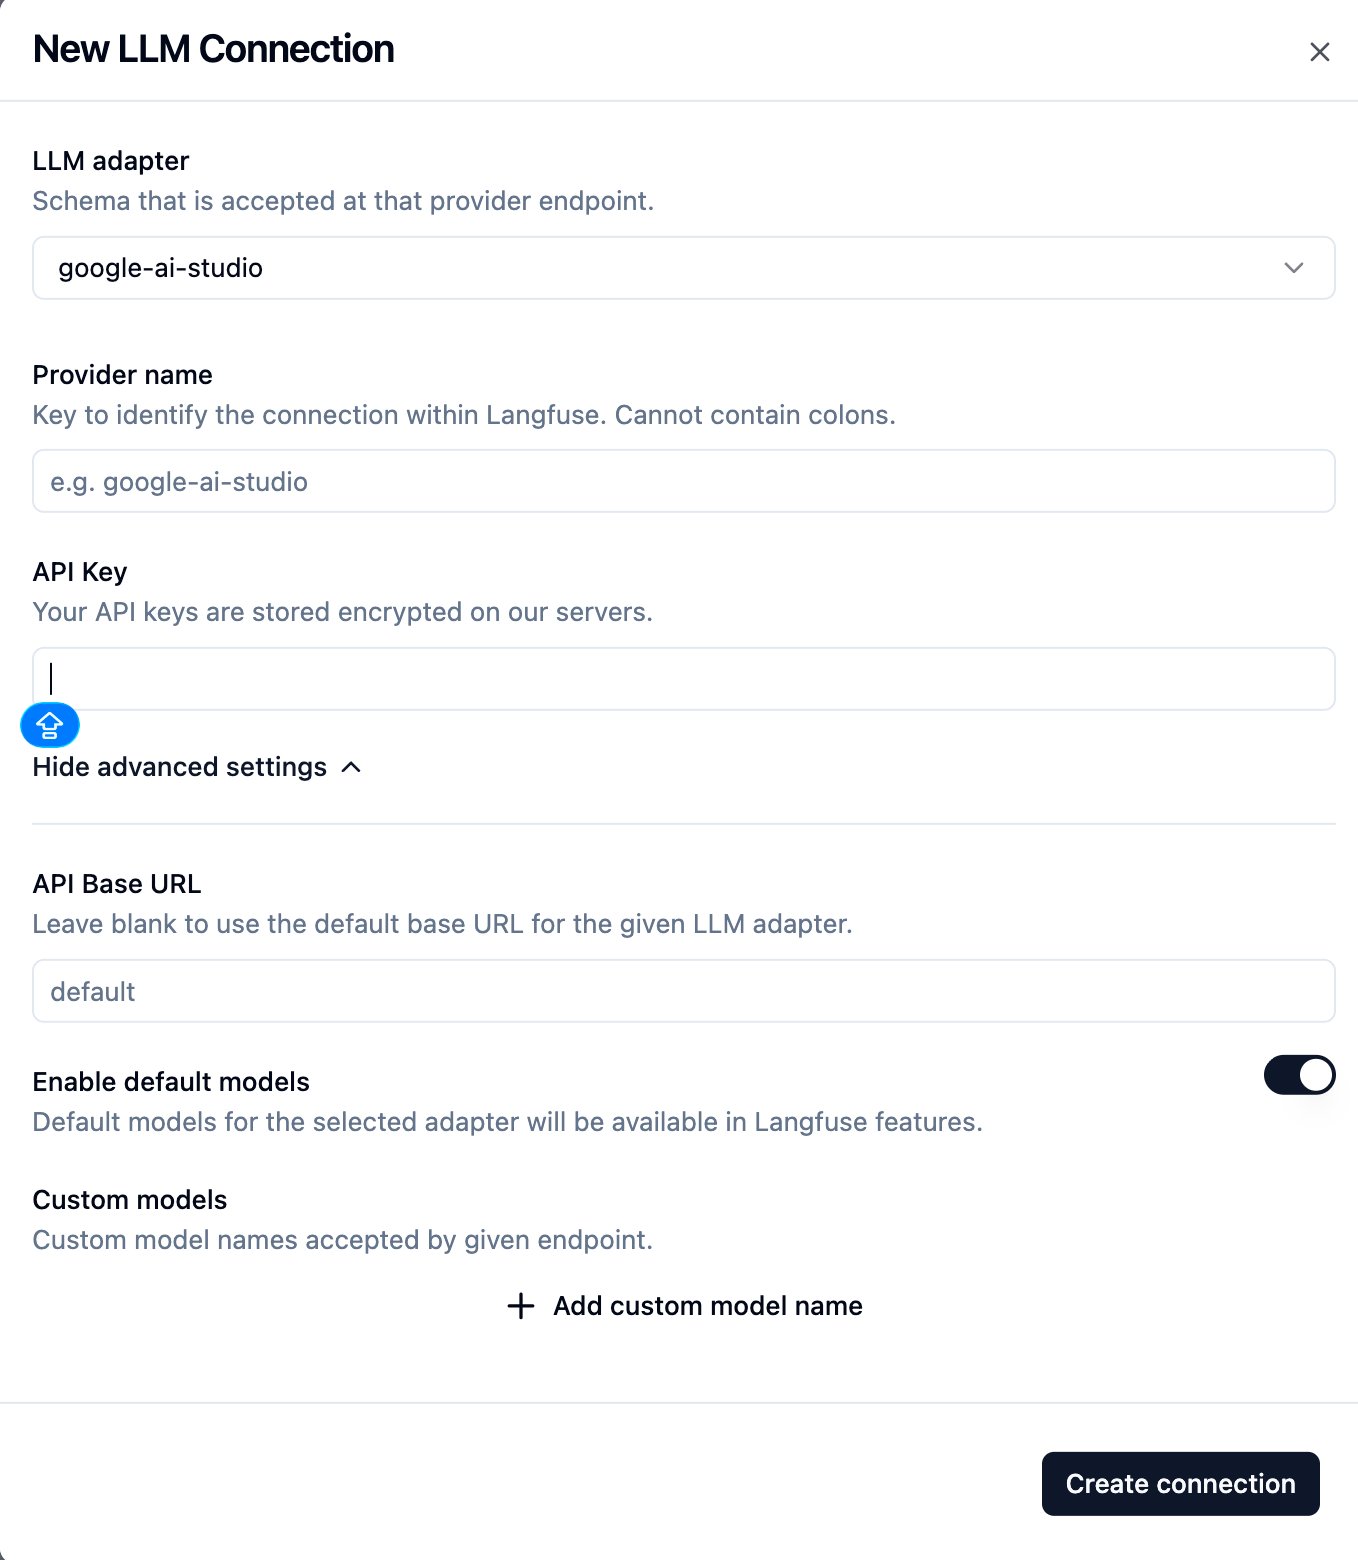
I used Google AI Studio’s free tier. Set the LLM adapter to google-ai-studio, enter your API key, and leave everything else at default.
Step 2: Choose a Model
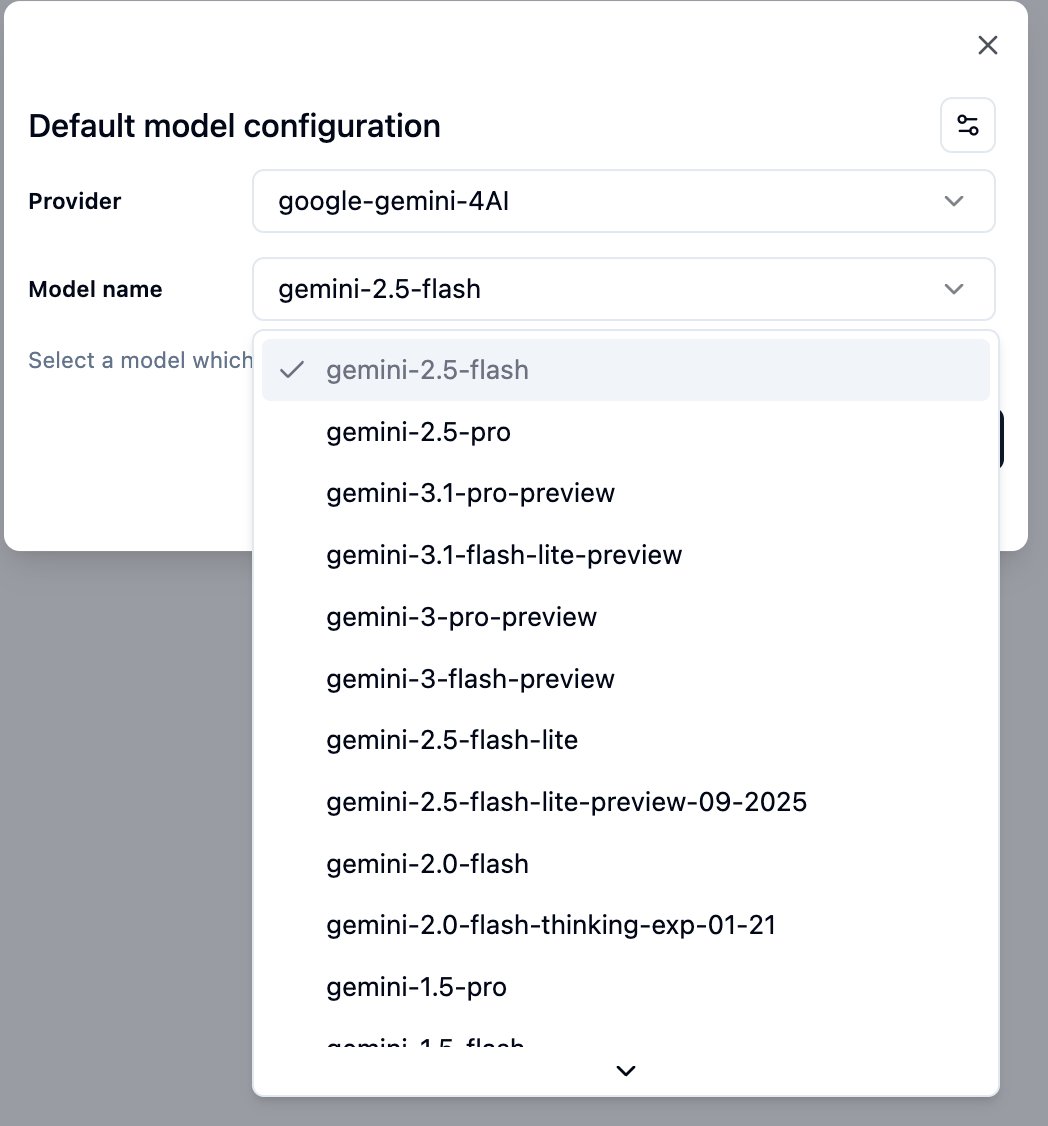
I recommend starting with gemini-2.5-flash — cheap, fast, and sufficient for evaluating math reasoning. Upgrade to gemini-2.5-pro later if quality isn’t good enough.
Step 3: Create a Custom Evaluator
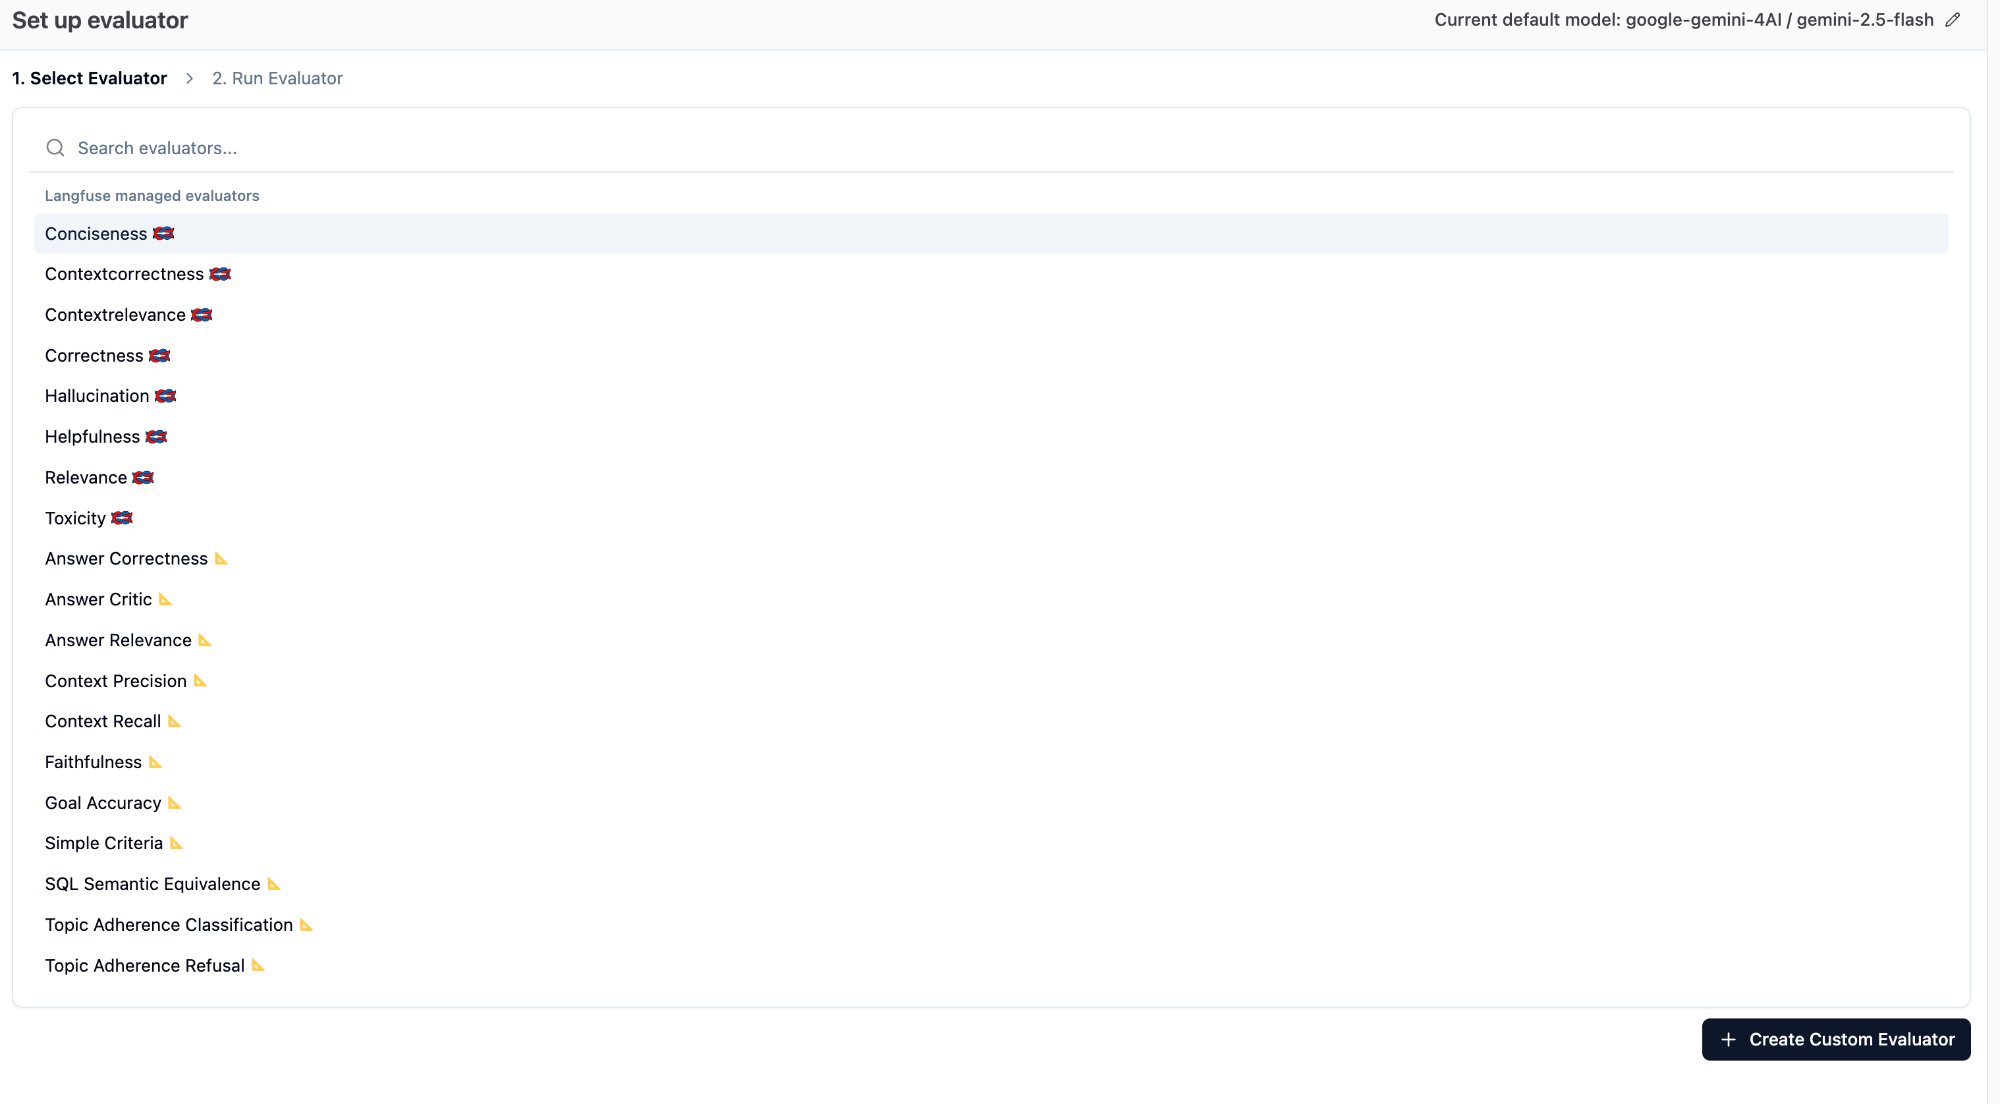
Langfuse offers built-in evaluator templates (Correctness, Hallucination, Relevance, etc.), but these are designed for general-purpose use. For math reasoning evaluation, you need a custom rubric. Click ”+ Create Custom Evaluator” in the bottom-right.
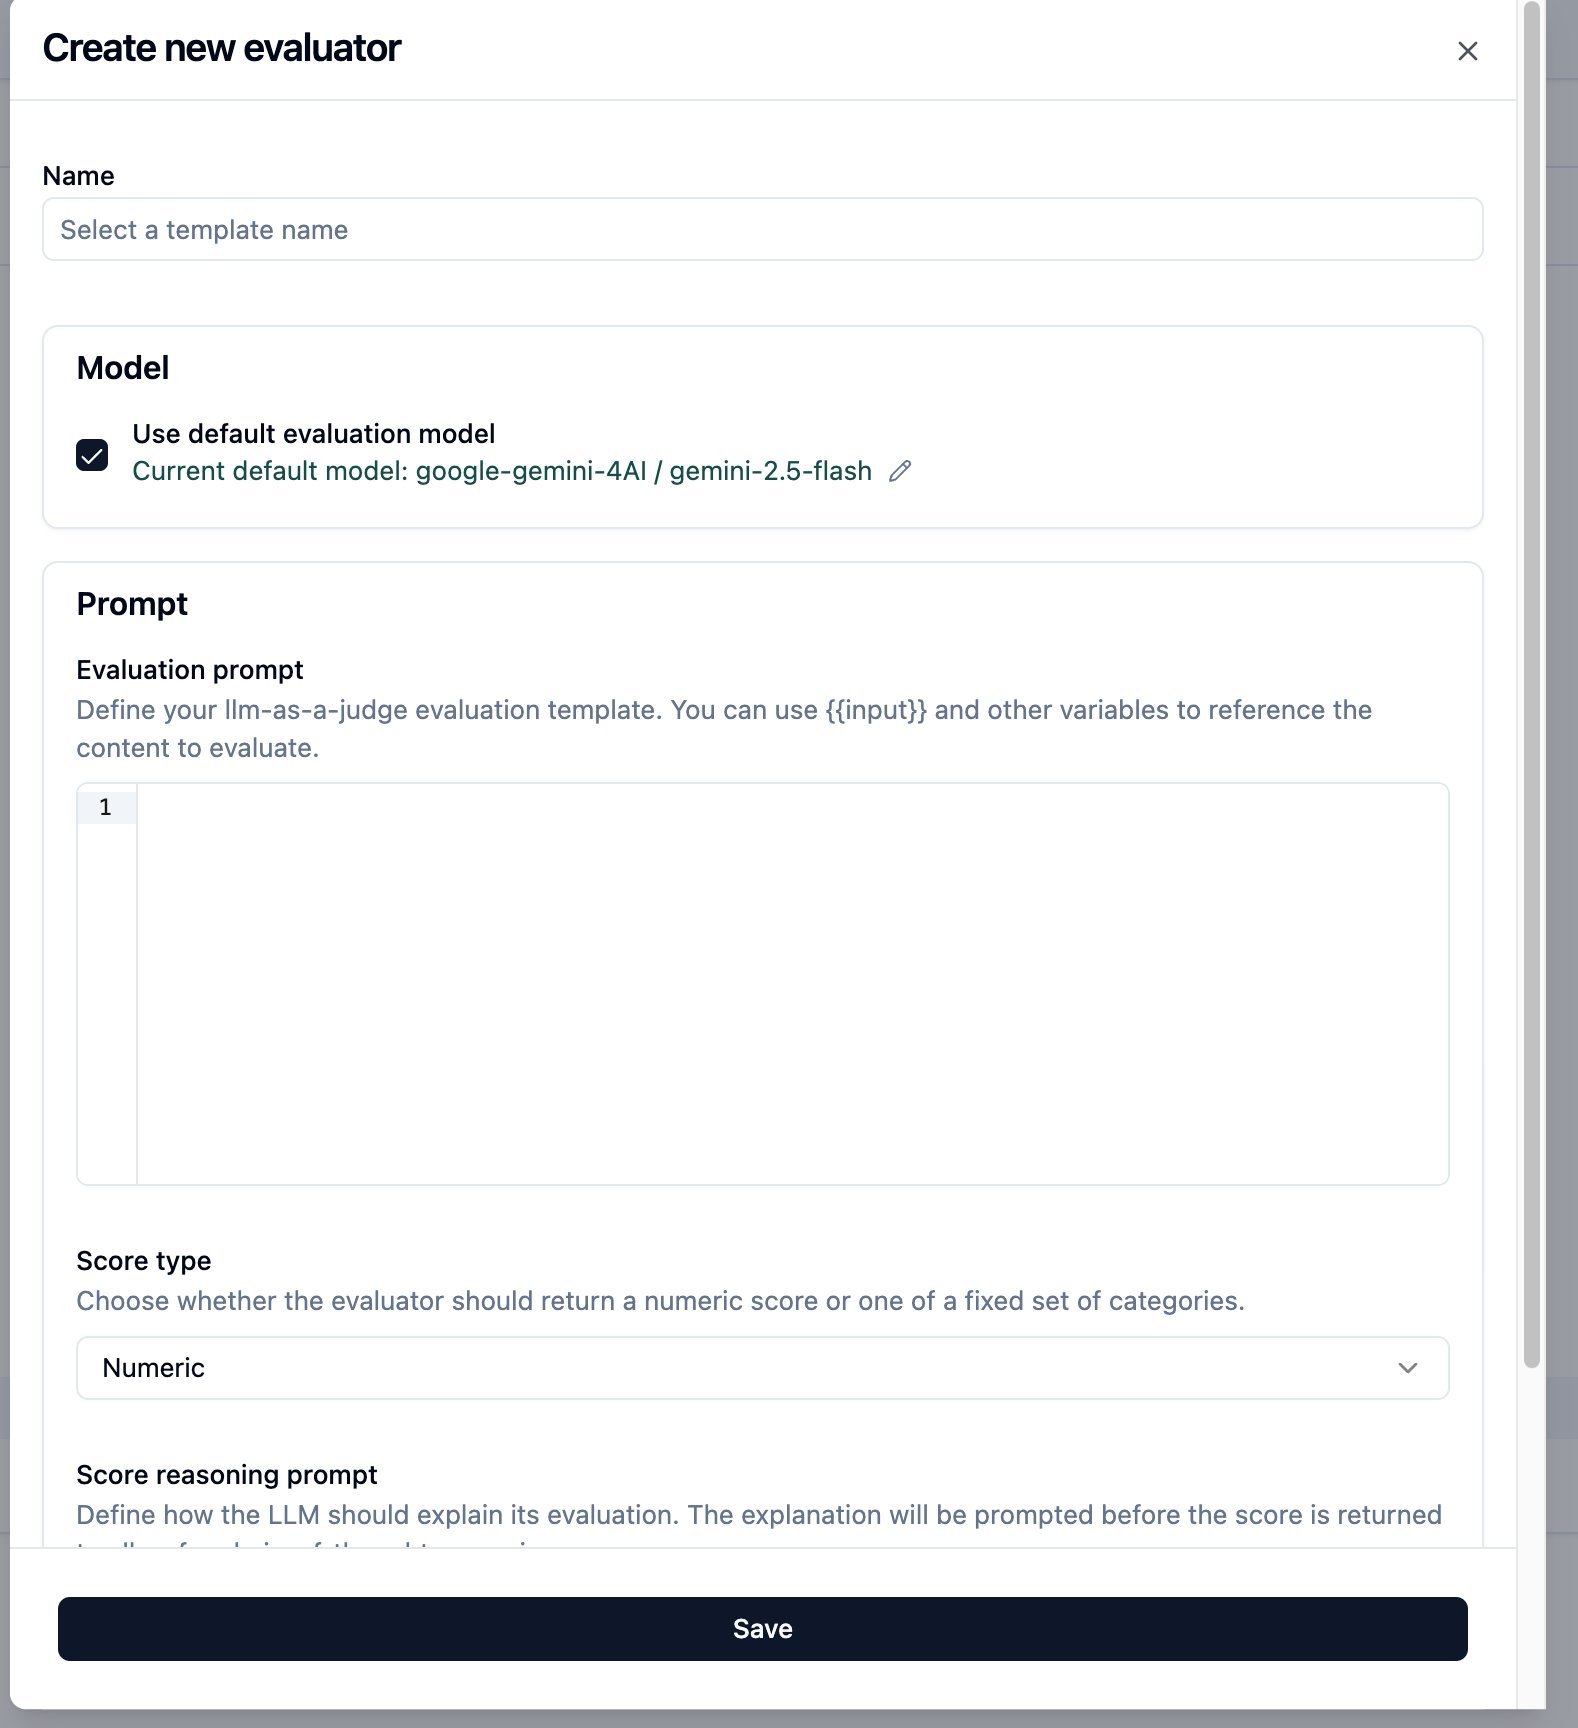
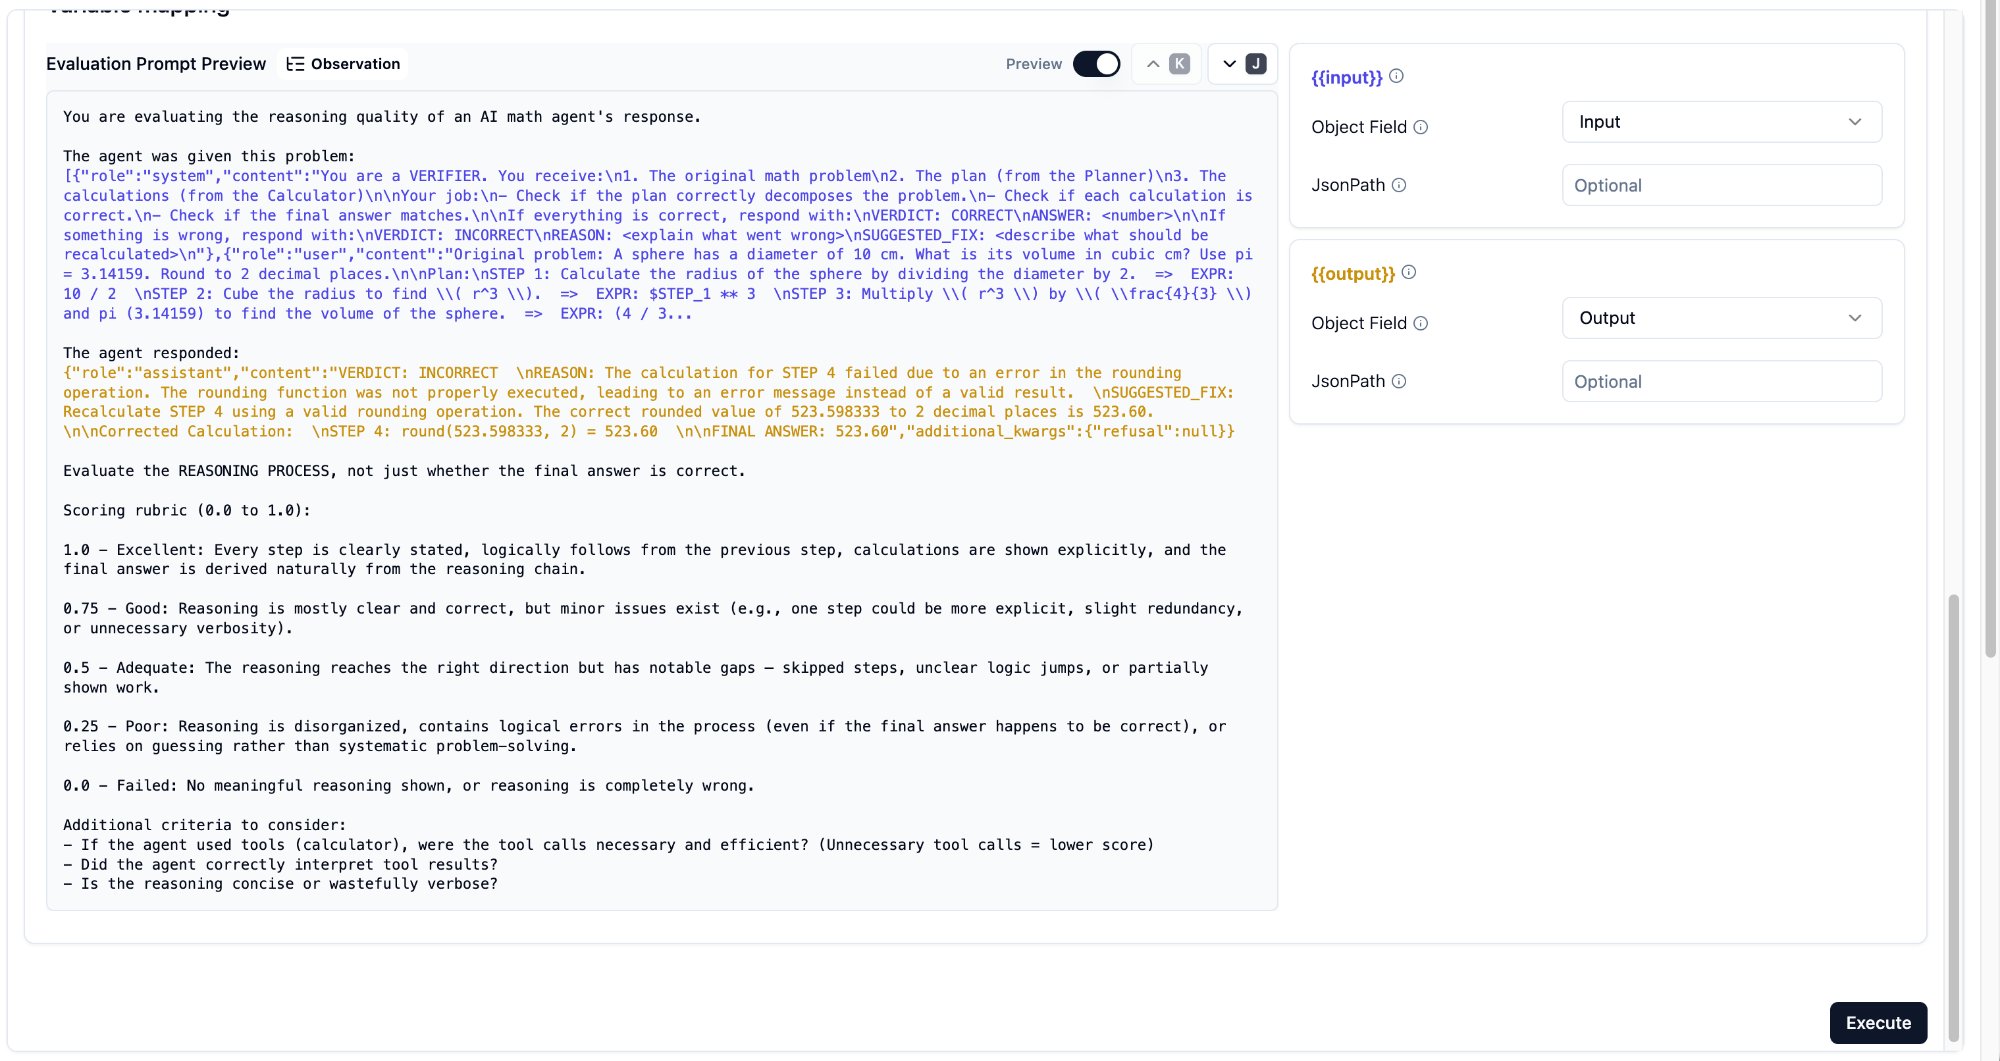
Write your rubric. My prompt uses both {{input}} (the problem) and {{output}} (the LLM’s reasoning response), so the judge can evaluate reasoning against the actual problem statement.
Step 4: Variable Mapping
Each {{variable}} needs an Object Field assignment. The options are Input, Output, and Metadata.
{{input}}-> Object Field: Input (the problem + system prompt){{output}}-> Object Field: Output (the LLM’s reasoning response)
Gotcha: Object Field Set to the Wrong Value
I initially set {{output}}’s Object Field to Input — which meant the judge received the prompt sent to the LLM, not the response from it. The Preview section helps you verify what each variable actually contains: blue text shows the input mapping, orange text shows the output mapping.
Gotcha: Evaluator Only Scores New Traces
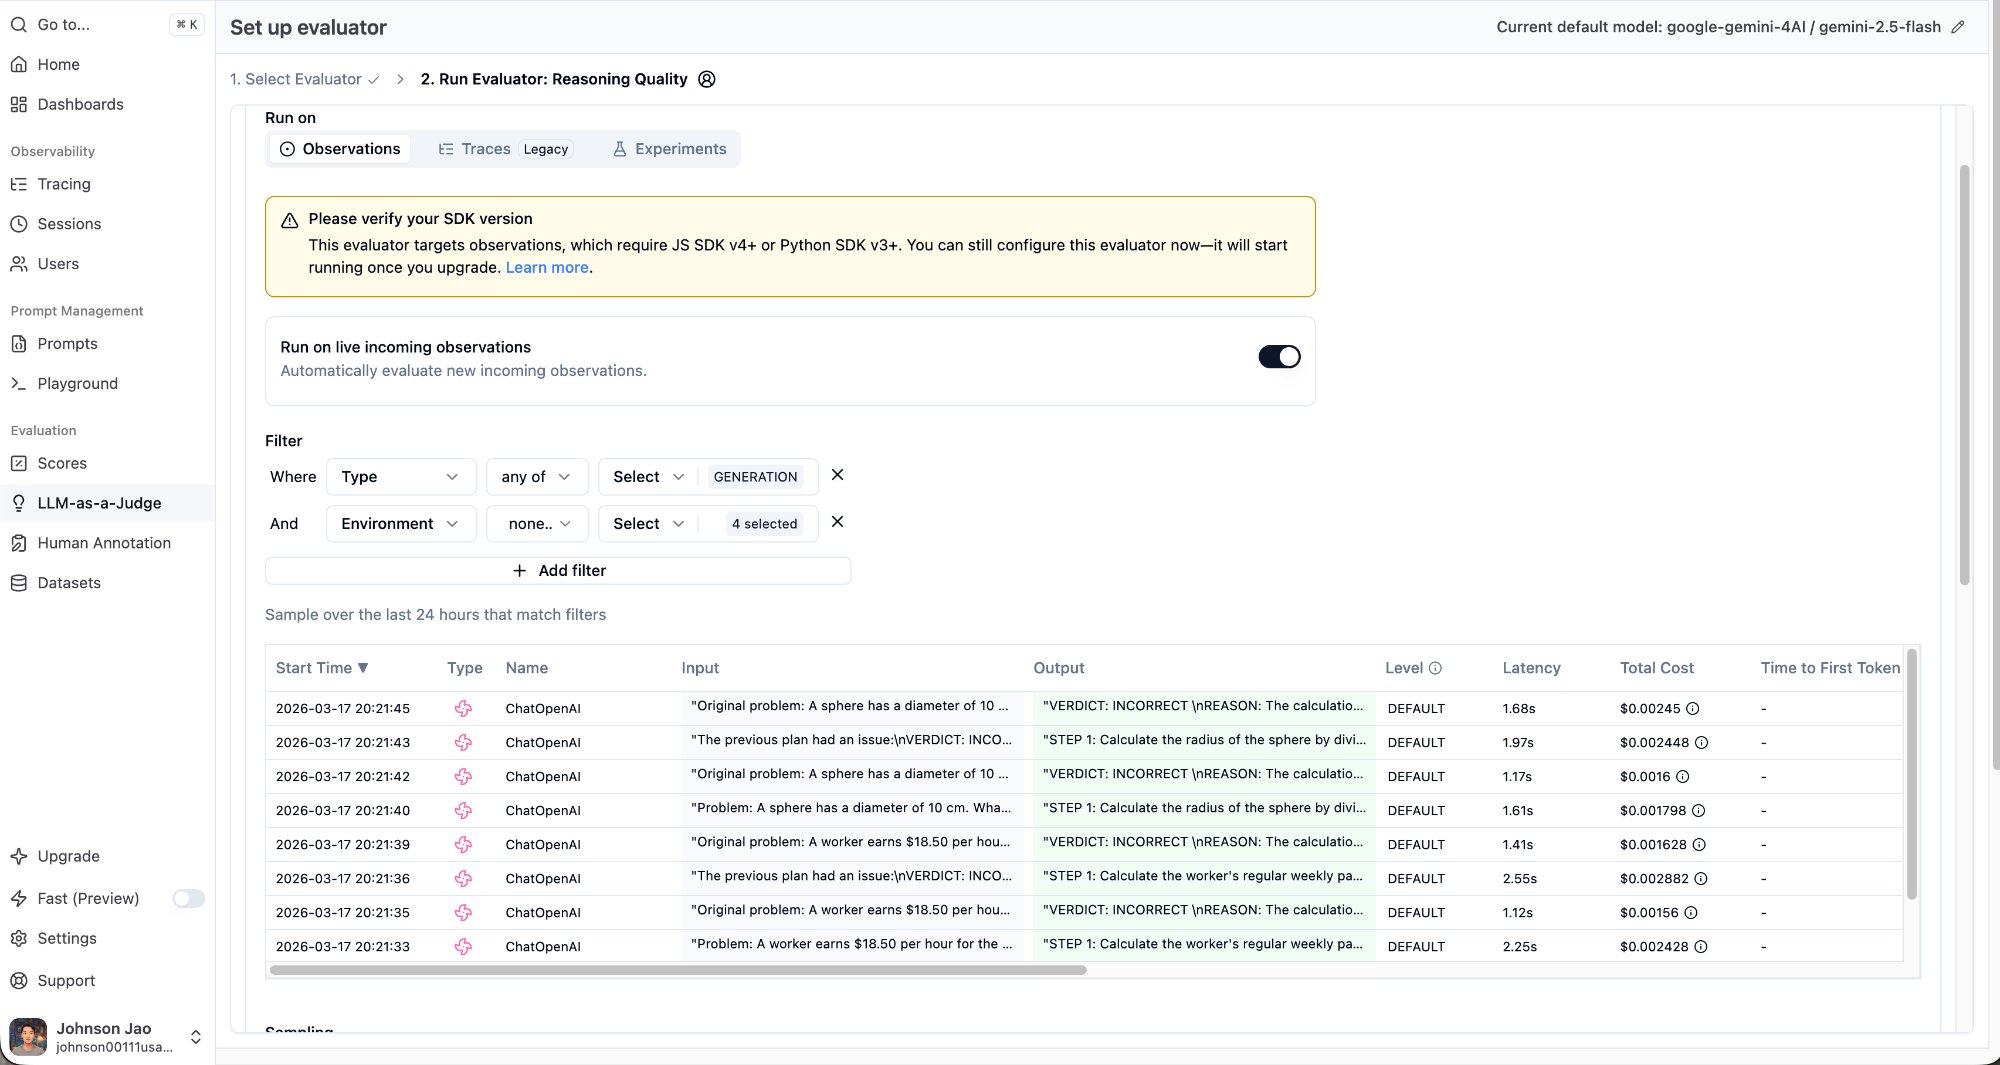
If the “Run on live incoming observations” toggle is enabled, the evaluator only grades observations that arrive after the evaluator was created. It will not retroactively process existing traces. If you want the judge to evaluate all traces, set up the evaluator before running your eval.
My approach: create the evaluator first, then re-run the full eval. As new traces come in, the evaluator grades them automatically.
Step 5: Verify Results
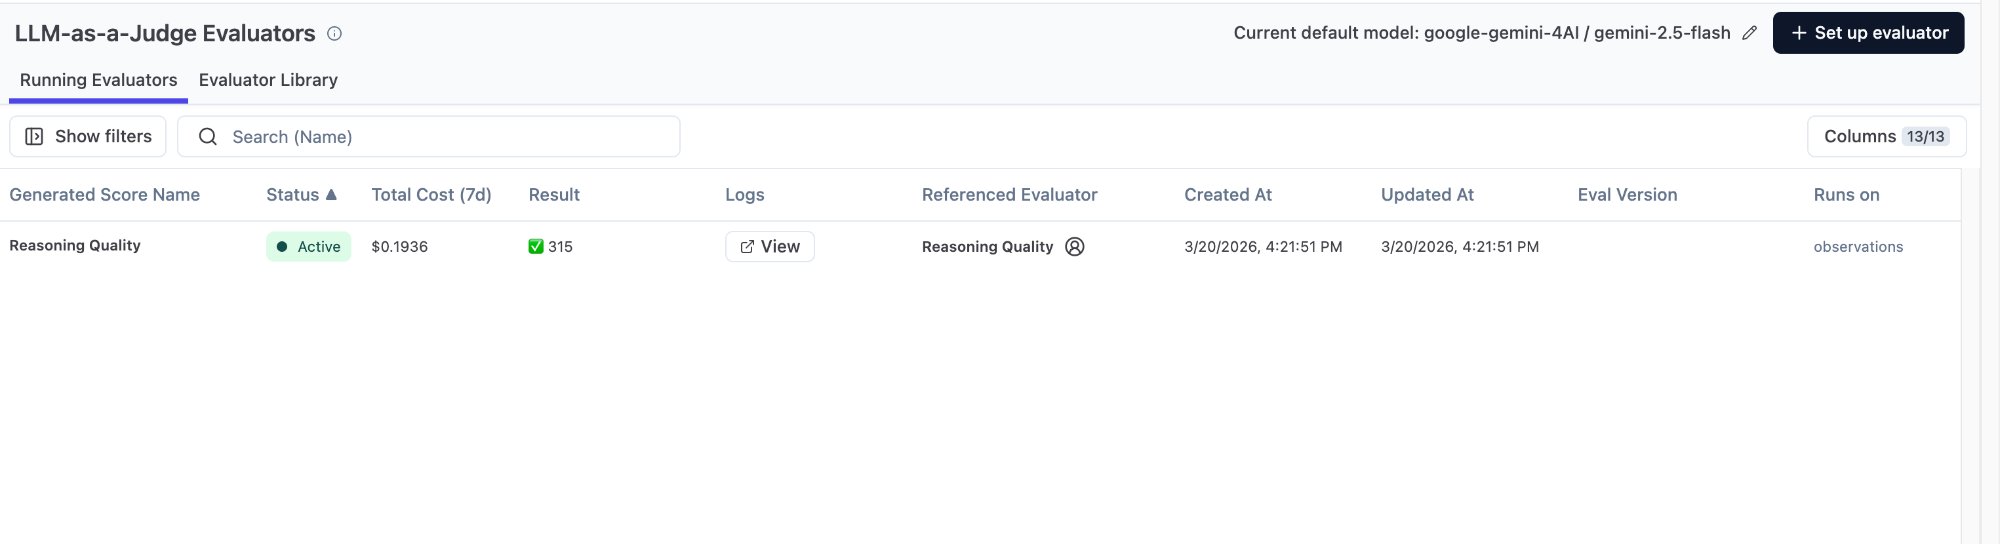
My evaluator finished with 315 results. Why 315 instead of 120? Because it was configured to Run on Observations with a Type = GENERATION filter — it graded each individual ChatOpenAI call, not each trace. ReAct has 2-3 GENERATION observations per trace, Multi-Agent has even more. 120 traces x ~2.6 GENERATION observations each = ~315.
This is actually better — you can see that ReAct’s “first round: decide which tool to call” and “second round: interpret the result” each get their own Reasoning Quality score.
Gotcha: Evaluator Log Is Empty
After creating my evaluator, I clicked into its log and found zero results. Two possible causes: Hobby plan limitations (requires upgrade to run), or the evaluator is still queued for processing. I refreshed after ten minutes and results started appearing. If nothing shows up, the alternative is to call the Gemini API from your own code and send scores back via create_score().
Exporting Data for Further Analysis
Gotcha: CSV Export Contains Incomplete Data
Langfuse supports CSV export. But I exported several times and kept getting partial data.
The first time, I got only 30 rows (only the constrained agent) — because a filter was still active when I exported.
The second time, I got 133 AGENT-type observations with no token/cost data and no scores — because I exported from the Observations tab, and scores are attached at the trace level, not the observation level.
The correct approach: Go to Tracing -> Traces (not Observations), clear all filters, then export. That CSV will include all scores (correctness, tool_call_count, efficiency, etc.) for each trace.
Self-Assessment: Do You Actually Know This?
The following 8 scenario questions all come from real usage experience. Each has one correct answer. If you can answer all of them correctly, you’re ready to navigate Langfuse dashboards independently.
Fundamentals
Scenario 1: You discover that the ReAct agent got question 18 wrong. You want to see how it interpreted the calculator’s return value of 19.5 in its second LLM call. What do you do?
- A. Scores page -> filter correctness = 0 -> view score details
- B. Tracing -> click eval-react-018 -> expand step tree -> click the second ChatOpenAI -> read the Assistant response
- C. Dashboard -> view ReAct’s average latency
- D. Sessions -> find the session -> view summary
Answer: B. The core debug path is Tracing -> click into a specific trace -> find the relevant LLM call in the waterfall -> read the full prompt and response. The Scores page can only tell you “right or wrong” — it can’t show you the reasoning process.
Scenario 2: You’ve run 120 questions and want to quickly view only the CoT agent’s traces. But the Trace Name filter lists each name with a count of 1 (because names like eval-cot-001 are unique). What do you do?
- A. Filter by Session ID
- B. Switch Trace Name to TEXT mode and type “cot”
- C. Manually check each box one by one
- D. Go to the Dashboard page for aggregate data
Answer: B. The Trace Name filter has SELECT and TEXT modes. SELECT is exact match; TEXT supports fuzzy search — typing
cotfilters all traces whose names contain “cot.”
Scenario 3: Your Tracing list shows completely blank Input/Output columns, but you’re certain the agents ran successfully. What’s the most likely cause?
- A. Langfuse SDK version is too old
- B. Your code didn’t pass input/output parameters when creating the trace; the data only exists inside the inner ChatOpenAI observation
- C. Network issues caused data loss
- D. You need to enable Input/Output display in Langfuse settings
Answer: B. LangGraph’s CallbackHandler automatically records prompts and responses inside the inner ChatOpenAI observation, but does not write them to the outermost trace. The Tracing list reads from the trace level’s Input/Output, so it’s empty. Fix this by explicitly passing an
inputparameter when creating the trace and callingspan.update(output=...)before the span closes.
Scenario 4: In your LLM-as-a-Judge setup, you set {{output}}’s Object Field to Input. What happens?
- A. The judge fails to run and throws an error
- B. The judge receives the LLM’s reasoning response (correct behavior)
- C. The judge receives the prompt sent to the LLM (not the response), making evaluation results inaccurate
- D. The Object Field setting has no effect on results
Answer: C. Object Field determines which field of the observation the variable pulls from. Input = the prompt sent to the LLM. Output = the LLM’s response. If you pick the wrong one, the judge is evaluating prompt quality instead of reasoning quality. Use the Preview feature to verify what each variable actually contains.
Advanced
Scenario 5: Your LLM-as-a-Judge evaluator is configured with Run on Observations, Type = GENERATION. You ran 120 traces, but the evaluator shows 315 completions. Why?
- A. The evaluator has a bug and ran duplicates
- B. Each trace contains multiple GENERATION observations (ReAct has 2-3 LLM calls), and the evaluator grades each one individually
- C. Old traces from previous runs were also evaluated
- D. The 315 count includes the evaluator’s own LLM calls
Answer: B. One CoT trace has ~1 GENERATION, one ReAct trace has ~3, Multi-Agent has ~3. 120 traces x ~2.6 average GENERATION observations = ~315. The evaluator grades each GENERATION observation individually, not each trace.
Scenario 6: The comparison table shows Constrained agent with 100% accuracy but only 0.91 Reasoning Quality (the lowest of all four). What does this mean?
- A. The Reasoning Quality scoring is wrong; it should match accuracy
- B. Constrained gets every answer right, but its reasoning process is inelegant (uses more tokens and LLM calls, like brute-forcing every problem)
- C. Constrained’s tool calls all failed; it got lucky guessing
- D. Langfuse’s LLM judge is biased against the Constrained agent
Answer: B. This is precisely the value of process-level scoring — accuracy and reasoning quality are two independent dimensions. Constrained averaged 3.5 LLM calls and 1,756 tokens per question (CoT needed only 1.1 calls and 465 tokens). It works harder but doesn’t make mistakes. The gap between outcome and process is only visible when you look at both scores simultaneously.
Scenario 7: You want to export the complete CSV for this eval run, including each trace’s correctness and process scores. You export from the Observations tab, but all score columns are empty. Why?
- A. Langfuse’s export feature has a bug
- B. Your
create_score()calls failed - C. Scores are attached at the trace level; exporting from the Observations tab doesn’t include trace-level scores
- D. Scores need 24 hours to appear in exports
Answer: C. Trace level and Observation level are two different concepts in Langfuse.
create_score()is called with atrace_id, so scores attach to traces. To export a CSV with scores, go to Tracing -> Traces and export from there, not from the Observations tab.
Scenario 8: You created the evaluator and then re-ran the full 120 questions. But you notice that the earlier test trace you ran manually (eval-cot-001) has no judge score. Why?
- A. That trace has a different format than the new ones
- B. The evaluator is set to “Run on live incoming observations,” which only evaluates traces that arrive after the evaluator was created
- C. The Hobby plan has a trace count limit
- D. You need to manually click Annotate on that trace to trigger evaluation
Answer: B. “Run on live incoming observations” means only new arrivals get evaluated — no retroactive processing. This is by design, not a bug. If you want all traces evaluated, set up the evaluator before running your eval.
Appendix: Quick Troubleshooting Reference
| Problem | Cause | Fix |
|---|---|---|
| Trace list Input/Output is empty | Code didn’t pass input/output to trace | Add input= parameter to start_as_current_observation() |
span.update() has no effect | Called outside the with span: block | Move it inside the with block, before the span closes |
| Trace Name filter shows count 1 for each | Trace names are unique (e.g., eval-cot-001) | Switch to TEXT mode for fuzzy search |
| LLM-as-a-Judge log is empty | Hobby plan limitation or still queued | Wait, or write your own LLM judge code + create_score() |
| Evaluator didn’t score old traces | ”Run on live” only evaluates new arrivals | Set up evaluator before running eval |
| Judge ran 315 times instead of 120 | Run on Observations; each trace has multiple GENERATIONs | This is normal — each LLM call is scored individually |
| CSV export has incomplete data | Filters still active, or exported from Observations tab | Go to Traces page, clear all filters, then export |
| {{output}} received the prompt instead of the response | Object Field set to Input instead of Output | Change to Output; use Preview to verify |
Appendix: Langfuse Page Navigation
| What you want to find | Where to look |
|---|---|
| All traces | Tracing -> Traces |
| Traces for a specific agent | Tracing -> Trace Name in TEXT mode |
| Step-by-step agent internals | Click into trace -> step tree -> ChatOpenAI |
| Full LLM prompt and response | ChatOpenAI node -> Preview -> System/User/Assistant |
| Token usage and cost | ChatOpenAI node -> top metric bar |
| Each agent’s pass rate | Scores page, filter by correctness |
| Process-level metrics | Scores page, filter by tool_call_count / efficiency |
| LLM judge reasoning quality scores | Scores page, filter by Reasoning Quality |
| All results from one eval run | Sessions page |
| Overall cost and latency trends | Dashboard page |
| LangGraph graph structure | Trace detail page, bottom-left flow diagram |
| Setting up LLM-as-a-Judge | Left sidebar -> LLM-as-a-Judge -> + Set up evaluator |